
Figures & data
Figure 1. Induction of cell death by azomethine H treatment in Arabidopsis roots. To the medium of liquid-cultured Arabidopsis seedlings, water (Control), 200 µM azomethine H (Azomethine), or 200 µM azomethine H plus 1 mM boric acid (Azomethine+B) were added. After incubation for 1 h, seedlings were stained with Evans blue to detect dead cells. An arrow indicates the region intensely stained with Evans blue. Scale bar = 500 µm.
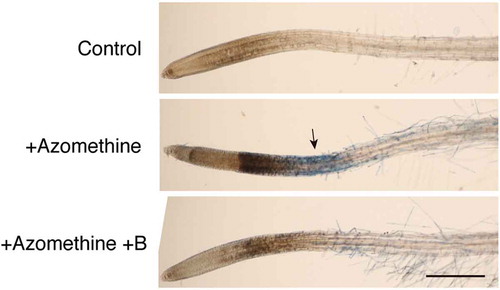
Figure 2. A working hypothesis for the immediate responses to boron (B) deprivation in Arabidopsis roots. B deprivation induces incomplete cross-linking of pectin thereby decreasing the tensile strength of the cell wall. The change may allow protoplasts to absorb water, which in turn causes the stretching of the plasma membrane. The mechanical change is converted to a cellular signal as calcium ions (Ca2+) enter through the activation of mechanosensitive calcium channels to induce downstream responses, including the overproduction of reactive oxygen species (ROS) and consequent cell death.
Figure 3. Involvement of reactive oxygen species (ROS) in rapid cell death induced by B deprivation. (a) Effects of an ROS scavenger and inhibitor on ROS synthesis. Hydroponically cultured Arabidopsis seedlings were treated with water (Control) or azomethine H (−B) as in . To examine the possible involvement of ROS in cell death, either TMP (1 mM), as a superoxide scavenger, or DPI (1 or 10 µM), as an inhibitor of superoxide synthesis, was added to the medium together with azomethine (−B+TMP, −B+DPI 1 µM, and −B+DPI 10 µM, respectively). Scale bar = 500 µm. (b) Detection of ROS in B-deprived Arabidopsis roots. Seedlings were treated with water (Control) or azomethine H (−B) for 1 h and then subjected to double staining with dihydroethidium (DHE) and 3′-O-acetyl-6′-O-pentafluorobenzenesulfonyl-2′,7′-difluorofluorescein (BES-H2O2-Ac), which preferentially react with superoxide or hydrogen peroxide, respectively. The roots were observed under a confocal laser scanning microscope. The bottom panels show merged images of DHE- and BES-derived fluorescence, in which signals from DHE and BES are shown in magenta and green pseudo-colors, respectively. Double-headed arrows indicate the region corresponding to the region intensely stained with Evans blue. Scale bar = 500 µm.
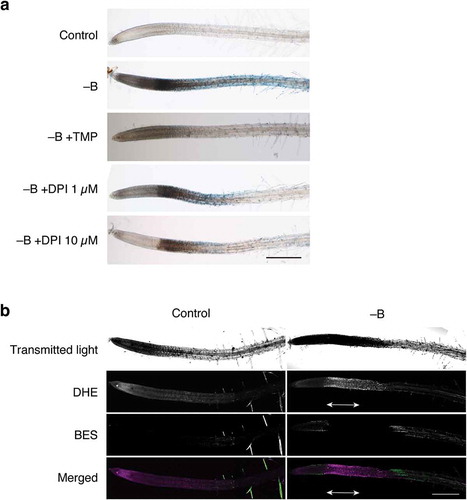
Figure 4. Involvement of calcium influx and membrane stretching in rapid cell death induced by boron (B) deprivation. Hydroponically cultured Arabidopsis seedlings were treated with water (Control) or azomethine H (−B) as in . To examine the possible involvement of calcium influx through mechanosensitive channels in cell death, 30 µM lanthanum ion, as a channel blocker, (−B+La) or 0.15 M sorbitol, as an osmoticum, (−B+sorbitol) was added together with azomethine H. Asterisk and arrowhead in the bottom panel indicate the region where darkening and Evans blue staining was seen in B-deprived roots (–B), respectively. Scale bar = 500 µm.
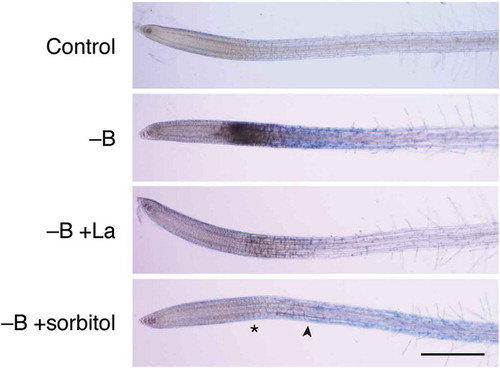
Figure 5. Involvement of nitric oxide (NO) in rapid cell death induced by boron (B) deprivation. (a) Effects of an NO synthesis inhibitor and an NO scavenger on cell death. Hydroponically cultured Arabidopsis seedlings were treated with water (Control) or azomethine H (−B) as in . To examine the possible involvement of NO in cell death, 1 mM NG-monomethyl-l-arginine, as an inhibitor of NO synthesis, (−B+NMMA) or 2-(4-carboxyphenyl)-4,4,5,5-tetramethylimidazoline-1-oxyl-3-oxide, as an NO scavenger, (−B+cPTIO) was added together with azomethine H. Scale bar = 500 µm. (b) Detection of NO in B-deprived roots. Seedlings were treated with water (Control), azomethine H (−B), or azomethine H plus NMMA (−B+NMMA) for 1 h. Seedlings were stained with 10 µM diaminorhodamine-4M acetoxymethyl ester (DAR-4M), incubated for 1 h in the dark, and observed under a confocal laser scanning microscope. The bottom panels show merged images from transmitted light images and DAR-4M signals. Scale bar = 500 µm.
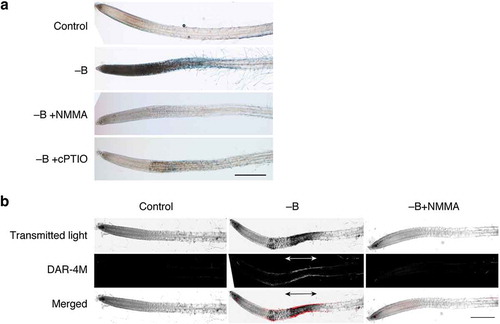
Figure 6. Scatter plot of expression values of genes in B-deprived and control samples. Log 2 values of fragments per kilobase of exon per million mapped sequence reads (FPKM) in each sample are plotted. Genes with significant differences in expression between B-deprived and control sample [false discovery rate ≤0.05 and an absolute value of log2 (fold change) ≥1] are shown as black dots, whereas those without significant differences are shown as gray dots.
![Figure 6. Scatter plot of expression values of genes in B-deprived and control samples. Log 2 values of fragments per kilobase of exon per million mapped sequence reads (FPKM) in each sample are plotted. Genes with significant differences in expression between B-deprived and control sample [false discovery rate ≤0.05 and an absolute value of log2 (fold change) ≥1] are shown as black dots, whereas those without significant differences are shown as gray dots.](/cms/asset/5e4d6312-b602-4aea-9da0-e97dee179fa3/tssp_a_1416670_f0006_b.gif)
Table 1. Gene ontology term enrichment analysis of the genes induced by boron (B) deprivation for 1 h.
Table 2. Top 10 gene sets with the highest overlap with B deprivation-induced genes observed using the gene set enrichment analysis.