Figures & data
Figure 1. Map of Tokyo City and the Kanto District.
Table 1. Changes in land use classification.
Figure 2. Changes in the distribution of green covered spaces in the Tokyo metropolitan area.
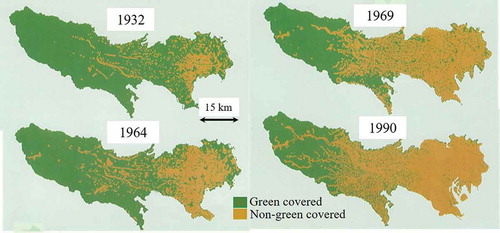
Figure 3. Time series of the land use and land cover maps of the southern part of the Kanto District for (A) 1972, (B) 1987, (C) 2001, and (D) 2011.
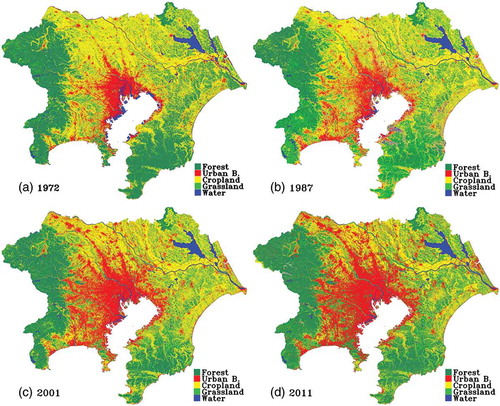
Figure 4. Changes in the pavement surface area ratio in the center of Tokyo between 1930 and 1990.
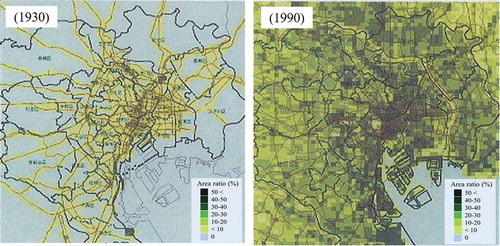
Figure 5. Trends in tropical and winter days per year in Tokyo (A) and Tsukuba (B). During a tropical day, the temperature rises above 30°C. During a winter day, the minimum temperature falls below 0°C. Archive data were taken from the website of the Japan Meteorological Agency (Citation2017b). However, observation points in Tokyo were relocated three times before 1964. A fourth relocation was carried out in December 2014.
Figure 6. Positive correlations between the rate of increase in air temperature (converted to the rate of increase per 100 years) and the surrounding urbanization rate.
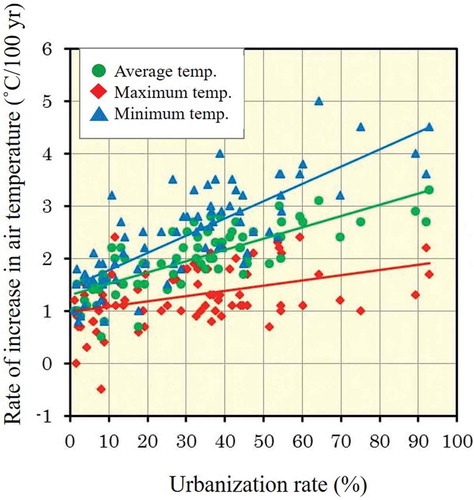
Figure 7. Artificial coverage rate (%) in the southern part of the Kanto District in 2006 (A). Change in the artificial coverage ratio (%) over the past 30 years (difference between the artificial coverage rate in 1976 and 2006) (B). Change in the daily average temperature estimated from the urban climate model (°C) (C).
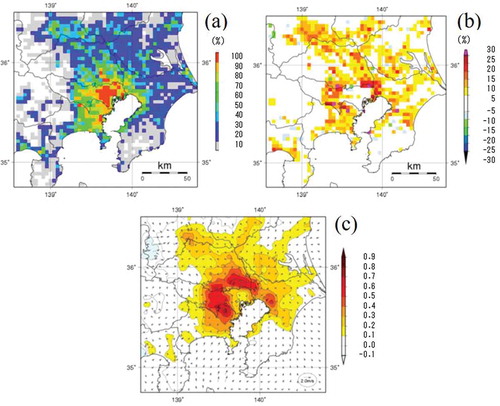
Figure 8. Differences in water movement between natural landscape and disturbed urban landscape. Source: Natural Resources Conservation Service of the US Department of Agriculture by Scheyer and Hipple (Citation2005). (A) Water movement in natural landscape with plant cover. This landscape is in a humid area. In drier regions, the stream level is higher than the surrounding land. (B) Water movement in a disturbed urban landscape with impervious surfaces and limited natural vegetation. This landscape is in a humid area. In drier regions, the stream level is higher than the surrounding land.
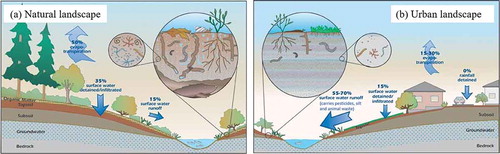
Figure 9. Changes in land use, water runoff rate, and flood arrival time in the Minami–Osawa watershed in the western part of Tokyo (Committee on Urban Hydrology Citation1986).