Figures & data
Table 1. Simple linear regression analyses for grain yield and shoot biomass in relation to iron material application rates.
Figure 1. Time courses of soil solution pH and soil Eh during the cultivation period. (a) and (c) are under CF cultivation and (b) and (d) are under WS cultivation. The plot and error bar represent the average and standard deviation, respectively. SSS and RIM denote SSS and residual iron material, respectively. The double-headed arrow indicates intermittent irrigation period.
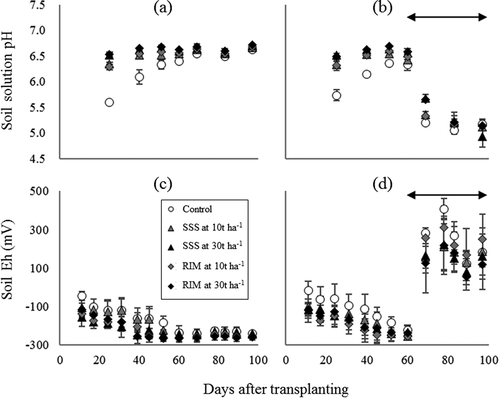
Figure 2. Time courses of the concentrations of dissolved As and Cd in soil solution during the cultivation period. (a) and (c) are under CF cultivation and (b) and (d) are under WS cultivation. SSS and RIM denote SSS and residual iron material, respectively. The plot and error bar represent average and standard deviation, respectively. The double-headed arrow indicates intermittent irrigation period. n.d. means dissolved Cd in soil solution was not detected (< 4.05 × 10⁻³ μg L−1).
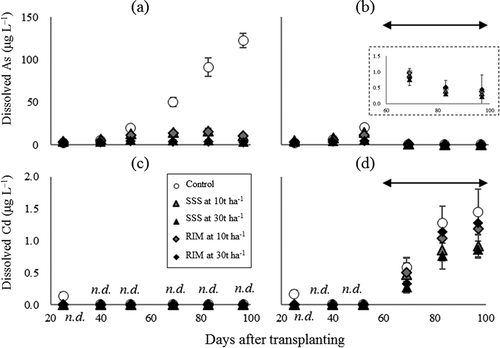
Figure 3. Simple linear regressions of the concentration of inorganic arsenic (iAs), total arsenic (tAs) and Cd in grains of rice grown under CF [(a), (c), (e)] and WS [(b), (d), (f)] cultivation in relation to iron (Fe) material application rates. Plot colors of gray and white indicate CF and WS cultivation, respectively. SSS and RIM denote SSS and residual iron material, respectively. n.d. and tr. indicate that the Cd concentration in grains range from 0 to 7.57 × 10⁻³ and 7.57 × 10⁻³ to 2.53 × 10⁻² mg kg−1, respectively.
![Figure 3. Simple linear regressions of the concentration of inorganic arsenic (iAs), total arsenic (tAs) and Cd in grains of rice grown under CF [(a), (c), (e)] and WS [(b), (d), (f)] cultivation in relation to iron (Fe) material application rates. Plot colors of gray and white indicate CF and WS cultivation, respectively. SSS and RIM denote SSS and residual iron material, respectively. n.d. and tr. indicate that the Cd concentration in grains range from 0 to 7.57 × 10⁻³ and 7.57 × 10⁻³ to 2.53 × 10⁻² mg kg−1, respectively.](/cms/asset/d142a3af-2244-41df-9498-363c9274d96e/tssp_a_1450077_f0003_b.gif)
Figure 4. Relationships between the concentrations of dissolved As and Cd and the logarithmic concentrations of iAs (a), tAs (b), and Cd (c) in rice grains. Only for Cd, data under CF cultivation was not shown because most of the concentration of dissolved Cd in the soils and Cd in rice grains were less than LOD or LOQ. Circle, triangle, and square indicate control, application of SSS, and application of residual iron material, respectively. Plot colors of gray and white indicate CF and WS cultivation, respectively.
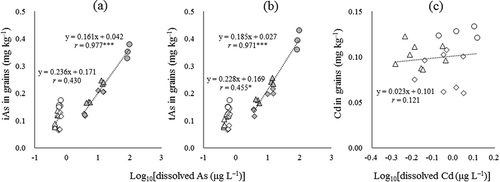
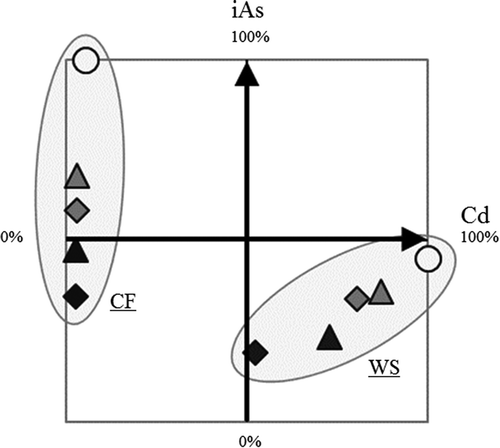
Figure 5. Relationship between the relative concentrations of iAs and Cd in grains grown under each culture condition. CF and WS mean CF and WS, respectively. The concentrations of iAs and Cd in grains grown on soils under CF and WS cultivation, respectively, were taken as 100%. circle, triangle, and square indicate control, application of SSS, and application of residual iron material, respectively. Plot colors of white, gray, and black indicate an iron material application rate of 0, 10, and 30 t ha−1, respectively.