Figures & data
Table 1. Soil characteristics at the plots used in this study.
Figure 1. AMF colonization of soybean roots with or without R10 inoculum at flowering stage. A line graph shows means of the colonization rates. Bars indicate standard deviation of the means. Stacked column charts show means of relative read abundance of R10-type and other indigenous AMF OTUs. En_15, Enrei examined in 2015; En_res., residual effect of AMF inoculum in 2015 on Enrei examined in 2016; En, Enrei examined in 2016; Mi, Misuzudaizu examined in 2016; Ak, Akishirome examined in 2016.
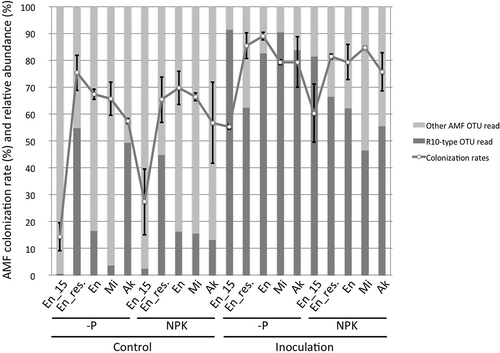
Figure 2. R10 inoculum effect on soybeans at flowering and seed maturation stages. Means of shoot dry weight at flowering stage (A) and seed maturation stage (B). Means of N uptake (C) and P uptake (D) at flowering stage. Bars indicate standard deviation of the means. Significant differences between inoculation and control treatments identified by t-test were indicated with asterisk(s) (*P < 0.05, **P < 0.01). Shoot dry weight in the plots of the residual effect on Enrei (En_res.) at seed maturation stage (B) was not determined. En_15, Enrei examined in 2015; En_res., residual effect of AMF inoculum in 2015 on Enrei examined in 2016; En, Enrei examined in 2016; Mi, Misuzudaizu examined in 2016; Ak, Akishirome examined in 2016.
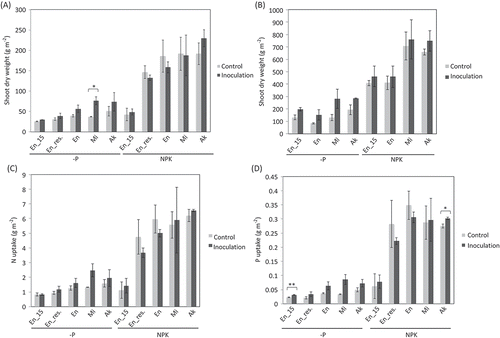
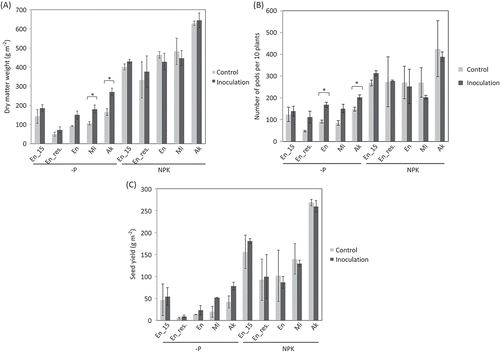
Figure 3. R10 inoculum effect on soybeans at harvest. Means of dry matter weight (A), number of pods per 10 plants (B), and seed yield (C). Seed yield were reduced by severe insect damage in particular 2016. Bars indicate standard deviation of the means. Significant differences between inoculation and control treatments identified by t-test were indicated with asterisk (*P < 0.05). En_15, Enrei examined in 2015; En_res., residual effect of AMF inoculum in 2015 on Enrei examined in 2016; En, Enrei examined in 2016; Mi, Misuzudaizu examined in 2016; Ak, Akishirome examined in 2016.