Figures & data
Table 1. Chemical and physical composition of the soil used for plant growth.
Table 2. Experimental time line and analysis over the growing period.
Table 3. Fertilizer treatments supplied to the soil at 47 DAS.
Table 4. Wheat growth responses to drought and fertilization at maturity, mean ± SEM (n = 6).
Figure 1. The effect of drought and fertilizer treatments on grain number and yield. Three genotypes (RAC875, Gladius and Mace) were grown to maturity and the following components measured. (a, b) Grain number, (d–e) grain yield, and (c, f) % loss of grain number and grain yield under drought (W/D*100) (n = 6, mean ± SEM). Statistical significance within a graph is indicated by different letters determined by two-way ANOVA with Bonferroni post-hoc analysis (p < 0.05).
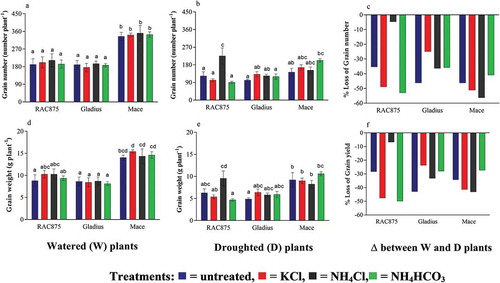
Figure 2. The physiological effect of drought and fertilization. The flag leaf from the main stem was assessed for (a, b) stomatal conductance, (c, d) photosynthesis, and (d, e) carbon isotope discrimination (Δ13C) in three wheat genotypes (RAC875, Gladius and Mace) at 70 days after sowing (n = 6, mean ± SEM). Statistical significance within a graph is indicated by different letters determined by two-way ANOVA with Bonferroni post-hoc analysis (p < 0.05). Graphs without letters indicate that means were not significantly different.
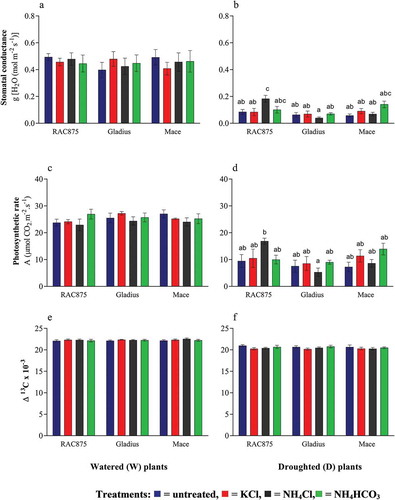
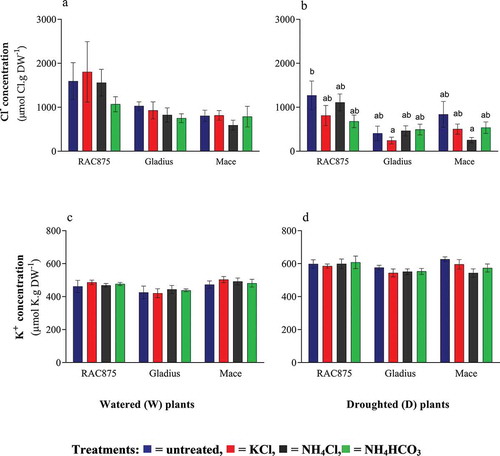
Figure 3. The effects of drought and fertilization on flag leaf accumulation of potassium and chloride. The concentration of (a, b) chloride and (c, d) potassium in the leaf below the flag leaf (FL-1) of three wheat genotypes (RAC875, Gladius and Mace) at 70 days after sowing (n = 6, mean ± SEM). Statistical significance within a graph is indicated by different letters determined by two-way ANOVA with Bonferroni post-hoc analysis (p < 0.05). Graphs without letters indicate that means were not significantly different.