Figures & data
Figure 1. BOR1 is localized in the trans-Golgi network and transported via RabE1D- and RabA5D-positive endomembrane compartments under low-B conditions. (A–J) Confocal images of BOR1-GFP and endomembrane markers, mCherry-Got1p homolog (A and B), VHA-a1-mRFP (C and D), mCherry-RabE1D (E and F), mCherry-RabA5D (G and H), or mCherry-RHA1 (I and J) in the root epidermal cells of Arabidopsis seedlings grown on low-B medium (0.5 µM boric acid). Plants were incubated in low-B medium containing 50 µM CHX for 30 min followed by DMSO (A, C, E, G, and I) or 50 µM BFA (B, D, F, H, and J) for 90 min. Lower panels represent enlarged images. Scale bars represent 10 (upper) and 2 µm (lower, enlarged images), respectively. (K) Pearson’s correlation coefficient between BOR1-GFP and endomembrane markers in the cytoplasm was calculated by the PSC colocalization plugin, Fiji/ImageJ. n = 10 cells. Error bars represent mean± SD. Asterisks indicate a significant difference with wild-type (*p < 0.0001 and ns, p > 0.05 by a two-tailed Student’s t-test).
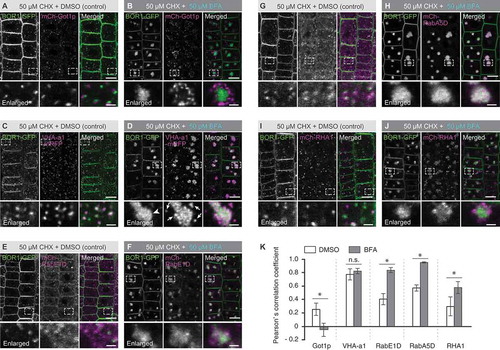
Figure 2. BOR1 is transported into TOL5-positive MVB/LE upon high-B supply. (A, B, D, and E) Confocal images of root epidermal cells of transgenic plants expressing BOR1-GFP and TOL5-mCherry under control of their own promoters grown under a low-B (0.5 µM boric acid) condition. Lower panels represent enlarged images. Scale bars represent 10 (upper) and 2 µm (lower, enlarged images). (A and B) The seedlings were incubated in low-B medium with 50 µM CHX for 30 min and then in medium with DMSO (A) or 50 µM BFA (B) for 90 min. (C) Pearson’s correlation coefficient between BOR1-GFP and endomembrane markers in the cytoplasm was calculated by the PSC colocalization plugin, Fiji/ImageJ. n = 10 cells. Error bars represent mean± SD. Asterisk indicates a significant difference with wild-type (*p < 0.001 by a two-tailed Student’s t-test). (D) The seedlings were incubated in low-B medium with 50 µM CHX for 30 min and then in the medium with 50 µM CHX, 30 µM Wm, and 50 µM BFA for 120 min. (E) The seedlings were incubated in low-B medium with 30 µM Wm for 20 min and then in medium with 100 µM boric acid and 30 µM Wm for 60 min.
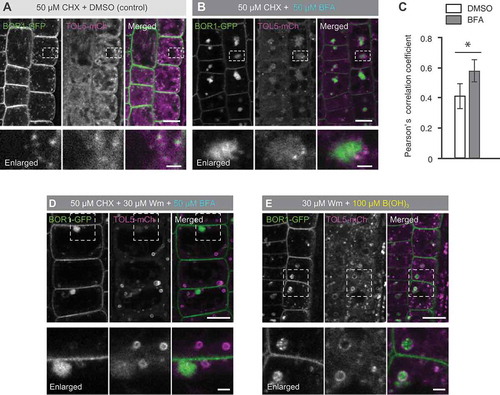
Figure 3. Vacuolar sorting of BOR1 requires TOL proteins-dependent MVB sorting. Confocal images of BOR1-GFP in the root epidermal cells of wild type (bor1-1 background) and tolQ seedlings transferred from 0.5 to 500 µM boric acid conditions for the indicated time. Scale bars represent 10 µm. WT, wild-type. The images were cropped from the images shown in Supplemental .
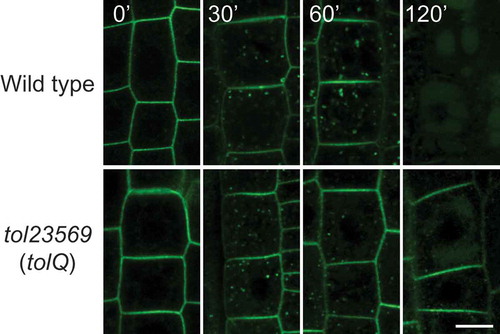
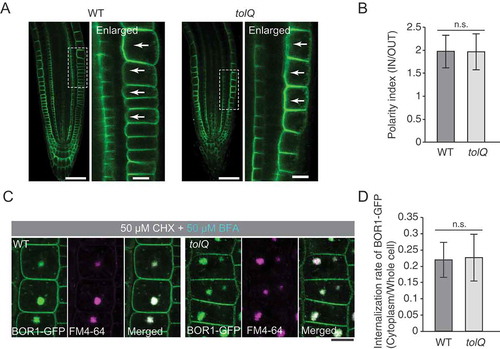
Figure 4. TOL proteins are not or little involved in the polar localization and the constitutive endocytosis of BOR1. (A) Confocal microscopy of BOR1-GFP in the primary root tips of wild type (bor1-1 background) and tolQ seedlings grown on low-B medium. Right panels represent enlarged images of regions indicated in the left panels. (B) Polarity indexes of BOR1-GFP in wild-type and tolQ plants. Fluorescence signals in the inner-half of the apical and basal plasma membrane domains were divided by that in the outer-half. n = 40 (wild type) and 28 (tolQ) cells from three independent plants. (C) Confocal microscopy of BOR1-GFP in the epidermal cells of wild-type and tolQ plants incubated in low-B medium with 50 µM CHX and 2 µM FM4-64 for 30 min and then with 50 µM BFA and 50 µM CHX for 90 min. (D) Internalization rate of BOR1-GFP in wild-type and tolQ plants. n = 98 (wild type) and 124 (tolQ) cells from three independent plants. There was no significant difference by Student’s t-test. Error bars represent SD. Scale bars represent 50 (A, left panels) and 10 µm (A, right panels and C). WT, wild type. n.s. represents no significance by two-tailed Student’s t-test (p > 0.05).