Figures & data
Figure 1. Fresh weight (A) and Dry weight (B) in canola plant and protein content (C) and soluble sugar content (D) in canola seed under drought, PEN, and Ca treatment. Vertical bars indicate Means ± SE based on three replicates. Different letters above columns indicated significant (P < 0.05) differences.
Table 1. Effects of PEN and Ca on different parameters in canola leaf under drought.
Figure 2. The effect of drought stress, PEN, and Ca on total phenol (A), flavonol (B), flavonoid (C), and anthocyanin (D) in canola seed. Vertical bars indicate mean ± SE of three replicates. Different letters indicate significant differences at P < 0.05.
Figure 3. The effect of PEN, Ca, and PEG on tocopherol content (A), inhibition of DPPH radical (B), palmitic acid (C), and palmitoloic acid (D) in canola seed. Vertical bars indicate mean ± SE of three replicates. Different letters indicate significant differences at P < 0.05.
Figure 4. Effect of PEN and Ca on stearic acid (A), oleic acid (B), linoleic acid (C), and linolenic acid (D) in canola seed under drought. Vertical bars indicate mean ± SE of three replicates. Different letters above columns indicated significant (P < 0.05) differences.
Figure 5. Impact of PEG, PEN, and Ca on ODR (A), LDR (B), and OLR (C) in canola seed. Columns indicate mean ± SE based on three replicates. Means with different letters for each cultivar indicate a significant difference at P < 0.05 using Duncan multiple range test.
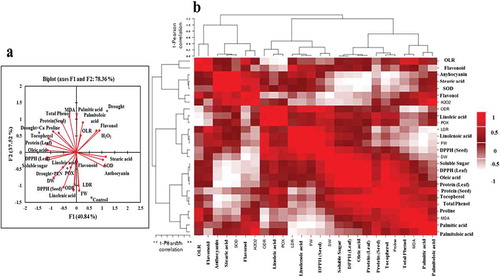
Figure 6. Loading plots of principle components 1 and 2 of the PCA (A) and Heatmap (B) of physiological and biochemical changes in canola.