Figures & data
Table 1. Degrees of dead trees wood decomposition.
Figure 1. Design of lysimeters: a – logs; b – polyethylene tube; c – silicone seal; d – plastic funnel with quartz sand; e – plastic hose; f – plastic bottle.
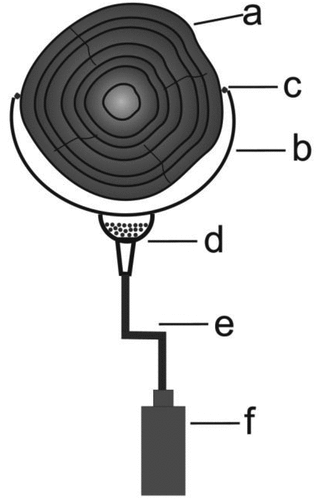
Table 2. Properties of leachate from deadwood different species in various decay classes (mean ± SD).
Figure 2. Dissolved organic carbon (DOC) concentration (mg · L−1) for coniferous (C) and deciduous (D) species in different decay classes (III, IV, and V); different lowercase alphabets mean significant differences.
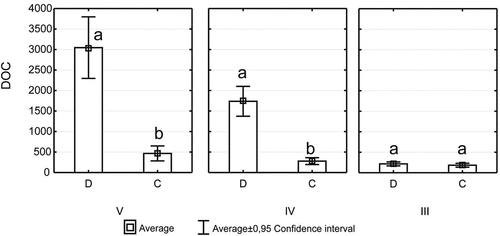
Figure 3. Total nitrogen (TN) concentration (mg · L−1) for coniferous (C) and deciduous (D) species in different decay classes (III, IV, and V); different lowercase alphabets mean significant differences.
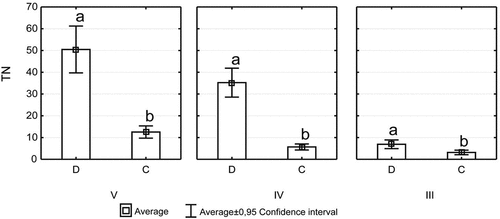
Table 3. Correlation between estimated parameters.
Table 4. Results of multivariate analysis of variance based on the general linear model (GLM) for the dissolved organic carbon (DOC), including the species and decay classes.
Figure 4. Relationships between dissolved organic carbon (DOC, mg · L−1) and electrical conductivity (EC, mS · cm−1).
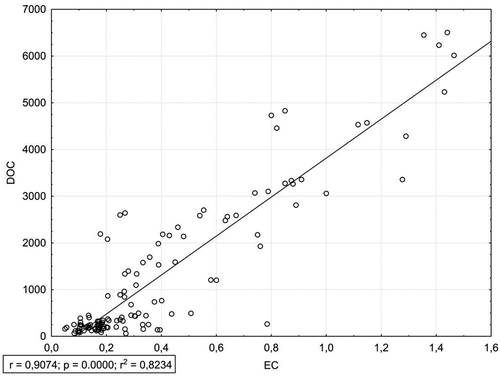
Figure 5. Relationships between total nitrogen concentration (TN, mg· L−1) and electrical conductivity (EC, mS · cm−1).
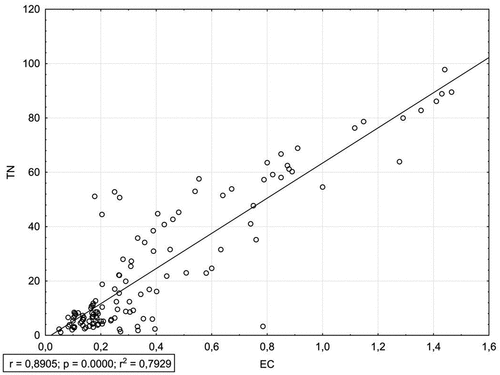
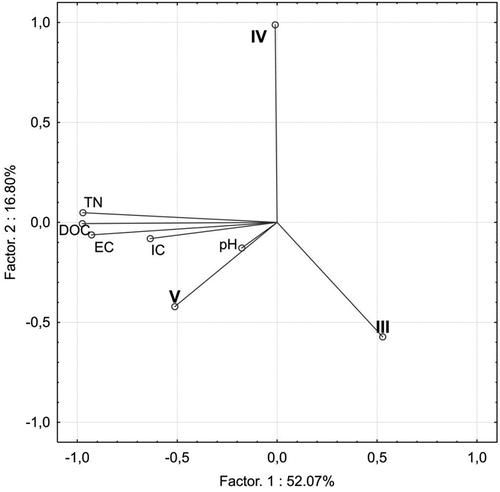
Figure 6. The projection of variables on a plane of the first and second factor of leachate from deadwood in various decay classes (III, IV, and V), IC: inorganic carbon; TN: total nitrogen; DOC: dissolved organic carbon; EC: electrical conductivity.