
Figures & data
Table 1. The morphological parameters of beet under the treatment of different concentrations of boron (N = 10, from independent plants)
Table 2. The thickness of beet leaves under the treatment of different concentrations of boron (N = 10, from independent plants)
Figure 1. Microscopic observation of the transverse section of leaves (×400, bar = 100 µm). Beet plants were treated with different concentrations of Boron (T1, 0.05 mg/L; T2, 0.5 mg/L; T3, 2 mg/L; T4, 30 mg/L) for 30 days. The representative images are shown (N = 10, from independent plants). UE, upper epidermis; PT, palisade tissue; ST, spongy tissue; LE, lower epidermis
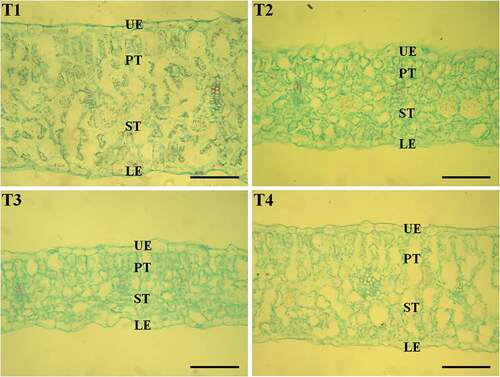
Table 3. The photosynthesis parameters in beet leaves under the treatment of different concentrations of boron (N = 5, from independent plants)
Figure 2. Microscopic observation of chloroplasts in beet leaves by transmission electron microscope (× 4000, bar = 10 µm). Beet plants were treated with different concentrations of Boron (T1, 0.05 mg/L; T2, 0.5 mg/L; T3, 2 mg/L; T4, 30 mg/L) for 30 days. The representative images are shown (N = 5, from independent plants). For analysis of chloroplasts, five images from five independent plants were used (five cells for each image)
Table 4. The endogenous hormone parameters in beet leaves under the treatment of different concentrations of boron (N = 5, from independent plants)
Table 5. The oxidative stress parameters in beet leaves under the treatment of different concentrations of boron (N = 5, from independent plants)
Table 6. Boron concentration in different tissues of beet under the treatment of different concentrations of boron (N = 5, from independent plants)