
Figures & data
Figure 1. Locations of the sampling sites in Tomioka town, Fukushima prefecture, Japan. The pin indicates the location of the Fukushima Daiichi Nuclear Power Plant (FDNPP) in Okuma town. This map is based on the blank map and aerial photograph published by Geospatial Information Authority of Japan (https://maps.gsi.go.jp/development/ichiran.html)
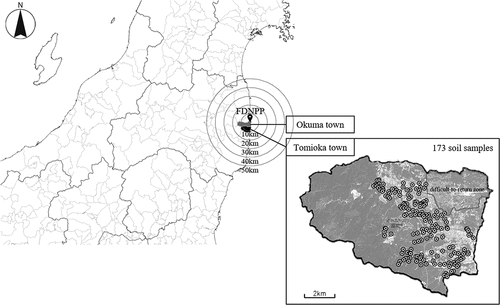
Table 1. Selected physicochemical properties of the soils
Figure 2. Boxplots of the distribution of the total 137Cs content in soils before and after decontamination. The quartiles and median value are shown as the boxes and the maximum and minimum values are shown as the whiskers. The total 137Cs content (collected in May 2014 and February 2016) before and after decontamination are from Tomioka town (2016) and corrected for decay from the sampling date
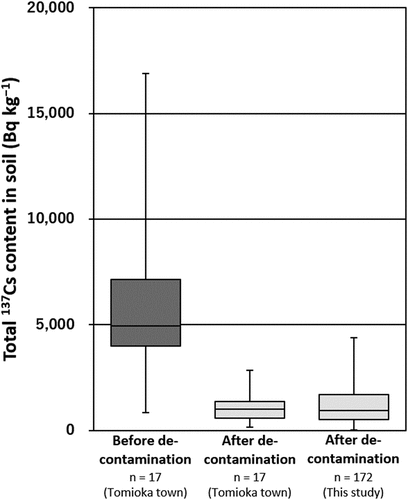
Figure 3. Comparison of the hourly air dose rate at a height of 1 m before and after decontamination (bars indicate standard deviation). The dose rate (measured from 30 July 2013 to 9 May 2016) before and after decontamination are from Tomioka town (2016)
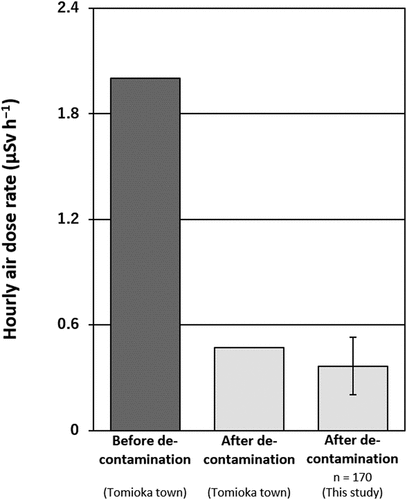
Figure 4. Relationship between the total 137Cs content in soils and the hourly air dose rate at a height of 1 m (n = 170) (** indicates P ≤ 0.01). The darker plots indicate fields located close to the border of forests or difficult-to-return zone
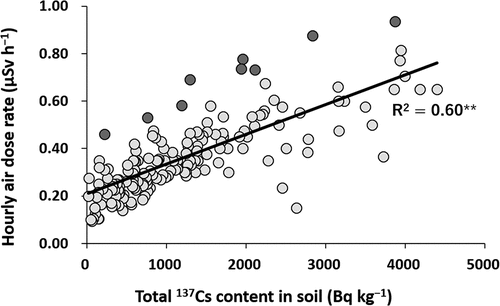
Figure 5. Relationship between the exchangeable K content in soils and the total 137Cs content in soils (n = 172) (** indicates P ≤ 0.01)
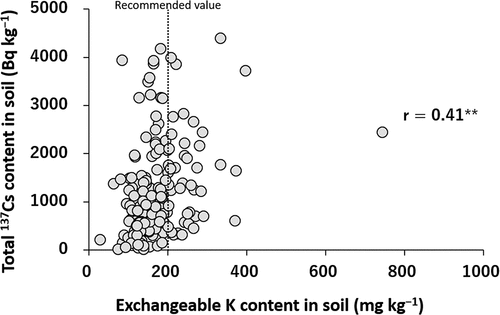
Figure 6. Relationship between the exchangeable K content in soils and the nonexchangeable K content in soils (n = 173)
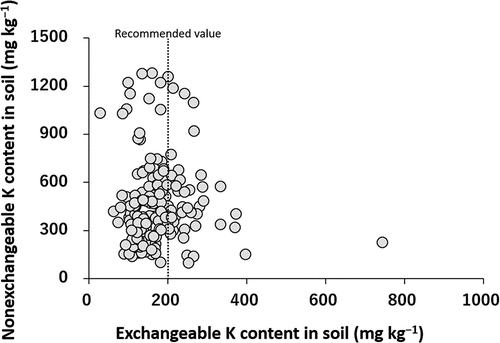
Table 2. Correlation coefficients between the 137Cs desorption ratio and selected physicochemical properties of the soils