Figures & data
Table 1. Analyses of variances for root length (RL), root dry weight (RW), shoot length (SL), shoot dry weight (SW), root Na+ content (Na+R), root K+ content (K+R), root Na+/K+ ratio (Na+/K+R), stem Na+ content (Na+S), stem K+ content (K+S), stem Na+/K+ ratio (Na+/K+S), leaf Na+ content (Na+L), leaf K+ content (K+L), leaf Na+/K+ ratio (Na+/K+L), value of selective transport K+ over Na+ from root to leaf (ST), leaf Na+ and K+ secretion rate (Na+Se and K+Se), Na+/K+ in secretion (Na+/K+Se), net photosynthetic rate (Pn), stomatal conductance (Cond), intercellular CO2 concentration (Ci), and transpiration rate (Tr) in bermudagrasses under salinity stress
Figure 1. Effect of different NaCl concentrations on root and shoot growth in two bermudagrasses. Mean values (±SD, n = 4) in each cultivar followed by the different lower-case letters are significantly different between NaCl treatments at P ≤ 0.05
Table 2. Effect of different NaCl concentrations on Na+ and K+ content and Na+/K+ ratio in root, stem, and leaf, and selective transport ability for K+ over Na+ from root to leaf (ST) of two bermudagrasses
Figure 2. Distribution of Na+ (e-h) and K+ (i-l) in the transection of root hair zone of salinity sensitive cultivar ‘Nanjing’ and salinity tolerant cultivar ‘Yangjiang’ from the line-scanning of an X-ray under control or 200 mM NaCl stress. Two independent samples per cultivar and treatment were used in the experiment, both of the samples showed the unanimous results, and one of the results was showed as representative in the figure. The relative Na+ or K+ content in Y axis was expressed as the percentage of the atomic number for Na+ or K+ element in a given site in the total atomic number for all the elements that can be detected. The horizontal line in the graph indicates the location of the line-scanning of an X-ray and the vertical line represents the boundary between the cortex and the stele. En, endodermis; V, vessel
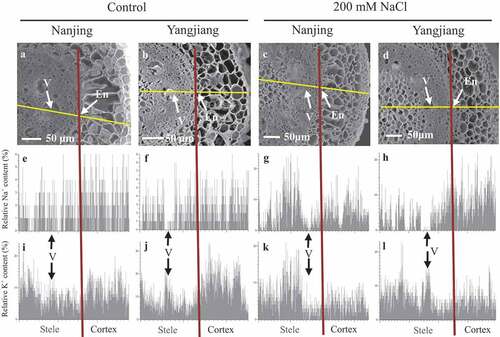
Figure 3. Secretory salt crystal (a, b) and salt gland (c, d) on the leaf of bermudagrass cultivars ‘Nanjing’ (a, c) and ‘Yangjiang’ (b, d) under 200 mM NaCl treatment. White Points in leaf surface (a, b) are secretory salt crystals. The solid arrow indicates salt gland and a dotted arrow indicates stoma in figure (c) and (d)
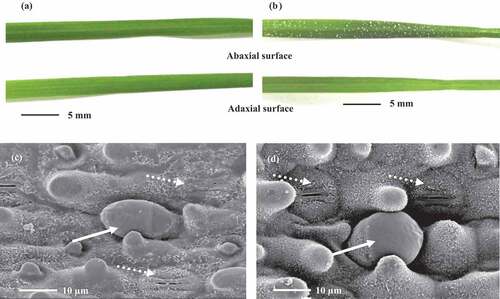
Figure 4. Salt gland number of different leaf surface in two bermudagrasses under 200 mM NaCl treatment. Mean values (±SD, n = 12) in the same leaf surface followed by the different lower-case letters are significantly different between cultivars at P ≤ 0.01. ** indicate salt gland number is significantly different at P ≤ 0.01 between leaf surfaces at the same cultivar
Table 3. Effect of different NaCl concentrations on Na+ and K+ secretion rate and Na+/K+ in secretion in two bermudagrasses
Figure 5. Effect of different NaCl concentrations on photosynthesis-related indicators in two bermudagrasses. Mean values (±SD, n = 4) in each cultivar followed by the different lower-case letters are significantly different between NaCl treatments at P ≤ 0.05