
Figures & data
Table 1. Fundamental properties of volcanic ash soils used in incubation experiment
Figure 1. Schematic time course of soil moisture during incubations with repeated dry wet cycles (a) and continuously constant moisture conditions (b). Gas samples from the gas collection periods in the wet and the moderate conditions were also applied to the analysis of stable carbon isotope abundances in CO2 (δ13C-CO2) released during the period
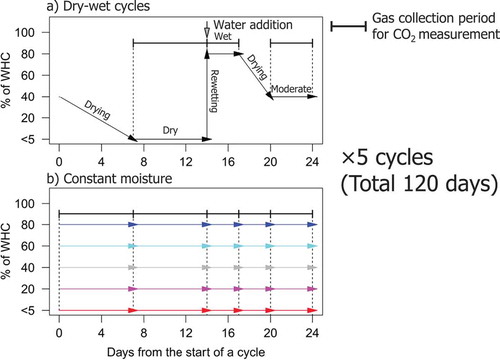
Figure 2. Time course of soil CO2 release rates during 120-day incubation with repeated dry-wet cycles and continuously constant moisture conditions. Two volcanic ash soils (soils A and B) collected from a single water catchment in a Japanese temperate forest were incubated individually with six different soil moisture treatments (i.e. dry-wet cycle (D-W) and five different levels of constant moisture from <5% to 80% of water-holding capacity (hereinafter abbreviated as % WHC)). The time course of % WHC during incubation with dry-wet cycles is shown by dashed lines. The experiment was conducted with two replicates per soil per treatment. The circles and error bars are means and standard deviations of the measured CO2 release rates for the two replicate samples
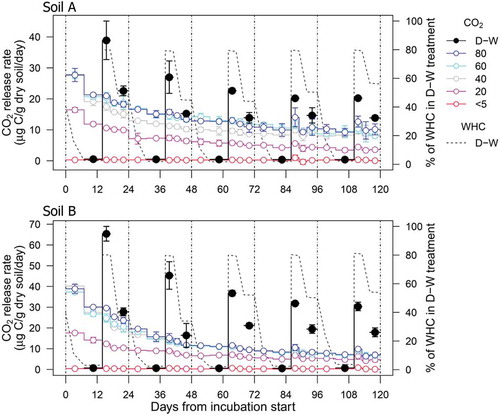
Figure 3. Relationships between CO2 release rate and % WHC for soils A and soil B incubated with five levels of constant soil moisture conditions. The soil CO2 release under the constant moisture conditions were fitted to the parabolic curves as a function of % WHC. The determined curves are presented with 95% confidence intervals (solid lines for soil A, dashed lines for soil B). The circles and error bars are means and standard deviations of the measured CO2 release rates for the two replicate samples
Table 2. Summary of measured and predicted CO2 release rates for incubation under repeated dry-wet cycles
Figure 4. Deviation of measured CO2 release from predicted CO2 release ([dCO2]) for soils A and B incubated with repeated dry-wet cycles. Upper panel (a) shows [dCO2], and lower panel (b) shows [dCO2] normalized by soil organic C content (i.e. 89 and 134 mg C g−1 dry soil for soils A and B, respectively, as in ). The predicted CO2 release rates were computed using the parabolic curves shown in . The circles and error bars from cycle 1 to cycle 5 are means and standard deviations for two replicate samples. The circles and error bars for all cycles are means and standard deviations for five cycles. The statistically significant probability (p by pair-wised t-test, n = 5 per a soil type per a water treatment) for differences between two soils are presented
![Figure 4. Deviation of measured CO2 release from predicted CO2 release ([dCO2]) for soils A and B incubated with repeated dry-wet cycles. Upper panel (a) shows [dCO2], and lower panel (b) shows [dCO2] normalized by soil organic C content (i.e. 89 and 134 mg C g−1 dry soil for soils A and B, respectively, as in Table 1). The predicted CO2 release rates were computed using the parabolic curves shown in Figure 3. The circles and error bars from cycle 1 to cycle 5 are means and standard deviations for two replicate samples. The circles and error bars for all cycles are means and standard deviations for five cycles. The statistically significant probability (p by pair-wised t-test, n = 5 per a soil type per a water treatment) for differences between two soils are presented](/cms/asset/41b6f781-9f5d-4038-bd12-c31666df1fd2/tssp_a_1649976_f0004_b.gif)
Figure 5. δ13C-CO2 during the incubations with repeated dry-wet cycles and continuously constant moisture conditions. δ13C-CO2 values are presented separately for the wettest condition (a) and the moderately wet condition (b). In the moderately wet condition, δ13C-CO2 for constant soil moisture are values estimated for soil moisture levels of dry-wet cycle incubation using δ13C-CO2 data obtained under constant soil moisture incubation with 20%, 40%, and 60% WHC (see text for details). The points (triangles and circles) and error bars for all cycles are means and standard deviations for five cycles. The statistically significant probability (p by two-way ANOVA, n = 5 per a soil type per a water treatment) for water treatment (W), soil (S), and their interactions (W × S) are presented. Triangles and circles represent the continuously constant moisture conditions and the repeated dry-wet cycles, respectively
Table 3. Statistical significance of linear relationship between δ13C-CO2 and incubation cycles 1 − 5 (n = 5)