Figures & data
Table 1. Field operations and sampling date of the Anjo and Omagari paddy fields
Figure 1. Acetate-extractable Fe(II) (a) and moisture contents (b) of the soils during a year of rice cropping season. Bars indicate the difference in the values of Fe(II) and moisture contents between two replicate plots, in which each plot has three (Fe) and two (moisture) replications. Asterisks (* and **) indicate significant differences between the rice cultivation period vs. the non-rice cultivation period and 0 − 1 cm depth vs. below 1cm depth (p < 0.05 and p < 0.01, respectively). Gray zones in the dates indicate the rice cultivation period
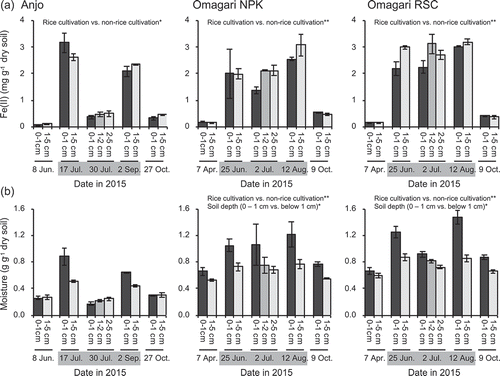
Figure 2. DGGE band patterns of Gallionella-related Fe-oxidizing bacterial 16S rRNA genes obtained from soil samples of three paddy fields (a) and principal component analysis of the patterns (b and c). The denaturant gradient range is 32–62%. The nucleotide sequences of the bands with closed symbols were determined. The numbers with the symbols corresponds to the OTU numbers in . Open symbols indicate the bands that sequences were not obtained. The numbers below the each lane shows the number of the bands observed from the each sample. PC, principal component. Percentages in parentheses show the contribution of each principal component. Diamond, triangle and square symbols indicate the samples obtained from the Anjo and Omagari NPK and RSC fields, respectively. Biplots of PC1 vs. PC2 (b) and PC1 vs. PC3 (c) are shown to explain the differences between the Anjo and Omagari fields and between the NPK and RSC plots in the Omagari field
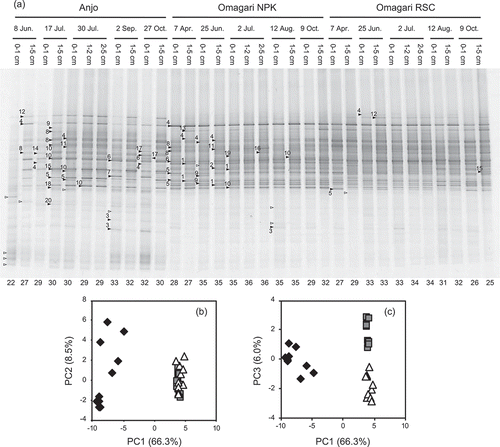
Figure 3. Phylogenetic relationships of 16S rRNA gene sequences retrieved from DGGE bands. Nucleotide sequences (541–543 bp) obtained in the present study were clustered into operational taxonomic units on the basis of 97% similarity. One sequence from each OTU was added in a neighbor-joining tree of the reference sequences (ca. 1400bp) by using the parsimony method of the software package ARB. The numbers in parentheses of each OTU indicate the number of sequences obtained from the Anjo and Omagari fields. Bootstrap values are shown as closed (>75%) and open circles (50–75%). Accession numbers of the references are inserted in parentheses. Nitrosomonas europaea ATCC 25978 is used as the outgroup. Bar, 0.1 substitutions per nucleotide sequence position
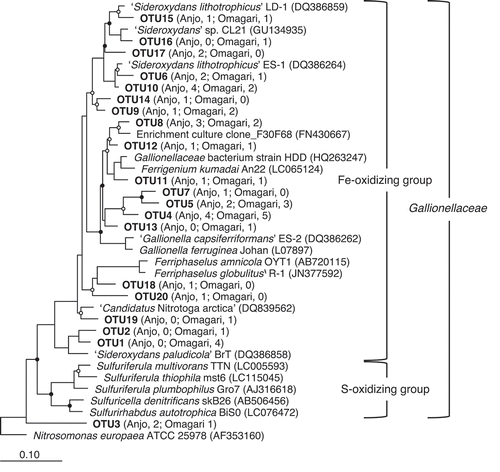
Figure 4. Copy numbers of 16S rRNA genes of Gallionella-related FeOB in the soils during a year of rice cropping season. Bars indicate the difference in the values of the copy numbers between two replicate plots, in which three DNA replicates were prepared in each plot. Asterisks (* and **) indicate significant differences between the rice cultivation period vs. the non-rice cultivation period and 0 − 1 cm depth vs. below 1cm depth (p < 0.05 and p < 0.01, respectively). Gray zones in the dates indicate the rice cultivation period
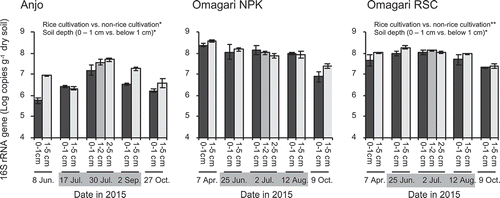
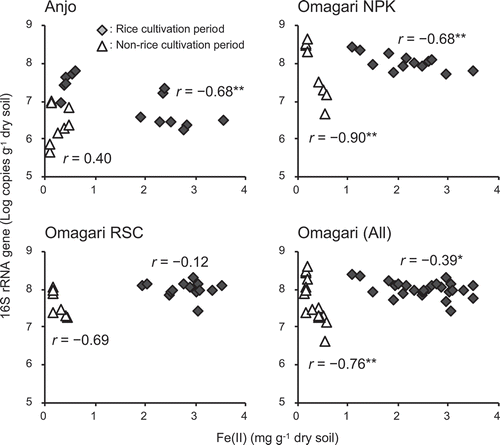
Figure 5. Correlations between the contents of acetate-extractable Fe(II) and the copy numbers of Gallionella-related Fe-oxidizing bacterial 16S rRNA genes. Diamonds and triangles are the values obtained from rice cultivation (from 17 July to 2 September and from 25 June to 12 August in the Anjo and Omagari fields, respectively) and non-rice cultivation periods (8 Jun and 27 October and 7 April and 9 October in the Anjo and Omagari fields, respectively), respectively. Asterisks (* and **) indicate that the values are significantly correlated (p < 0.05 and p < 0.01, respectively)