
Figures & data
Figure 1. Arrangement of the experimental paddy fields in a three-year experiment from 2016 to 2018.
Table 1. Specific dates of agricultural practices in the experimental fields from 2016 to 2018.
Figure 2. Seasonal change in air temperature, precipitation, CH4 and N2O fluxes, soil reduction/oxidation potential (Eh) at depth of 10 cm, and soil bivalent iron (Fe2+) content in experimental paddy fields during the rice cultivation period in 2016.
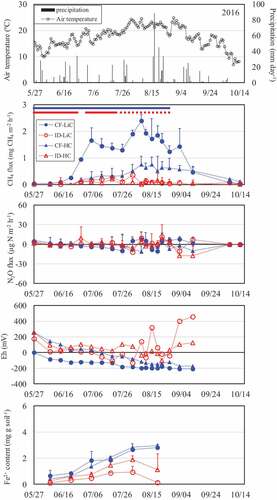
Figure 3. Seasonal change in air temperature, precipitation, CH4 and N2O fluxes, soil reduction/oxidation potential (Eh) at depth of 10 cm, and soil bivalent iron (Fe2+) content in experimental paddy fields during the rice cultivation period in 2017.
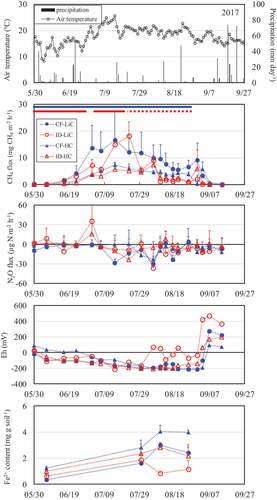
Figure 4. Seasonal change in air temperature, precipitation, CH4 and N2O fluxes, soil reduction/oxidation potential (Eh) at depth of 10 cm, and soil bivalent iron (Fe2+) content in experimental paddy fields during the rice cultivation period in 2018.
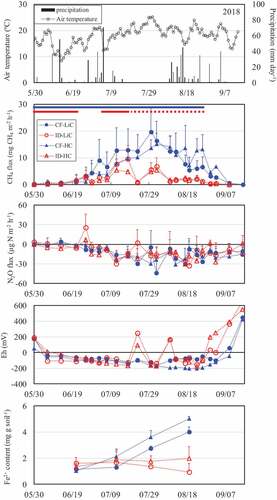
Table 2. Cumulative CH4 and N2O emissions in the experimental paddy fields from 2016 to 2018.
Table 3. Brown rice grain yields in the experimental paddy fields from 2016 to 2018.