Figures & data
Figure 1. Relationships among the elevation, soil hydrological parameters and Soil Taxonomy of study area.
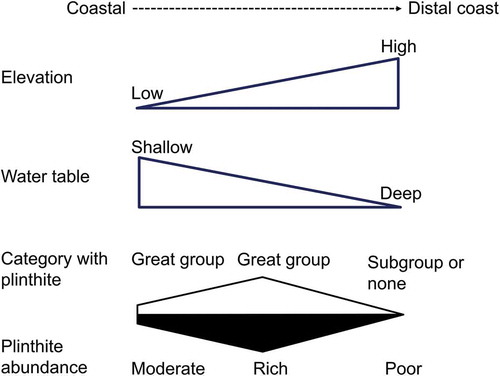
Figure 2. Location of study area (a) and sampling sites of reference pedons and additional pedons (b).
Table 1. Morphological characteristics of reference and additional pedons in the study area.
Table 2. Classification in Soil Taxonomy and hydrological parameters for all pedons.
Figure 3. Relationships between elevation and soil hydrological parameters including (a) plinthite volume proportion (PVP, %), (b) average annual saturated time (AAST, %) at plinthic horizon, and (c) average annual reduced time (AART, %) at plinthic horizon for the reference pedons. The solid line is a linear regression line, and the dashed line is the range of the 95% confidence level.
Figure 4. Relationship between elevation and PVP (%) for all pedons. The solid line is a polynomial quadratic regression line, and the dashed line is the range of the 95% confidence level.
Figure 5. The proposed soil mapping of plinthite in the study area.