Figures & data
Table 1. Statistical values of radiocesium concentrarions in brown rice and TF values among the soil groups.
Table 2. Statistical values of radiocesium soil concentrations, and soil properties along with plow depth among the soil groups in 2012.
Table 3. Pearson’s correlation coefficients (r) among radiocesium concentrations in brown rice, TF, and main soil properties for Andosls in 2012.
Table 4. Pearson’s correlation coefficients (r) among radiocesium concentrations in brown rice, TF, and main soil properties for gray lowland soils in 2012.
Figure 1. Relationship between the Clay/T-C value and Ex-K2O content in the soil after the harvest in 2012.
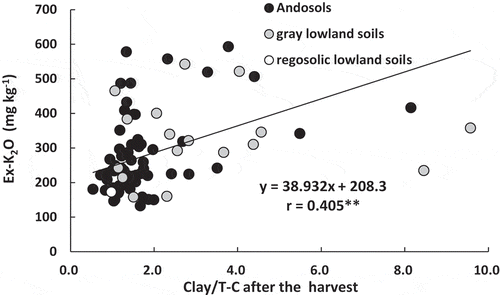
Figure 2. Relationship between Ex-K2O content in the soil after the harvest and TF in 2012.
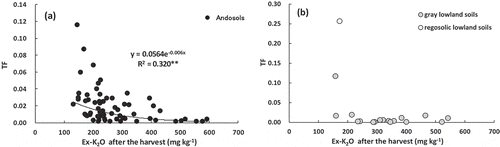
Figure 3. Relationship between Ex-Cs concentration in the soil after the harvest and TF in 2012.
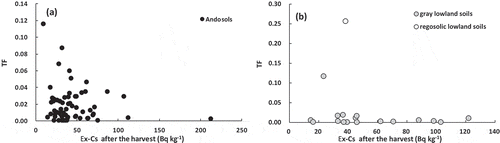
Figure 4. Relationship between T-Cs concentration in the soil after the harvest and TF in 2012.
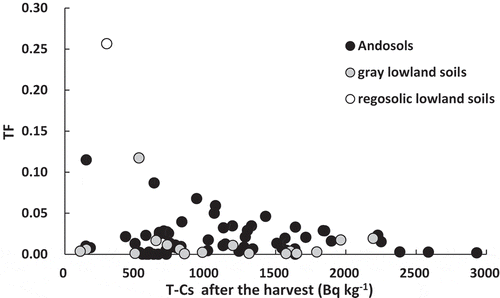
Table 5. Comparison of TF values between Andosols and gray lowland soils with the same Ex-K2O content.
Figure 5. Relationship between Ex-K2O content in soil after the harvest and TF for the 3 years of the study.
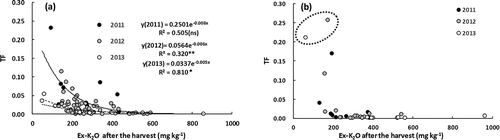
Table 6. Changes in TF values and Ex-K2O in samples collected in each of the three years, and the samples with TF exceeding 0.1.
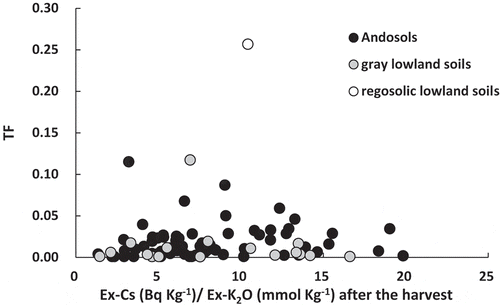
Figure 6. Relationship between Ex-Cs/Ex-K2O in the soil after the harvest and TF in 2012.