
Figures & data
Figure 1. Strawberry cultivation in a small hydroponic equipment (Kyowa Co., Ltd., Osaka, Japan), using the Japanese strawberry cultivars ‘Benihoppe’ and ‘Kirapika.’.
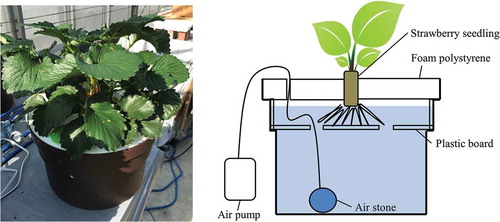
Table 1. Nutrient solution composition.
Figure 2. Temperatures during cultivation. The temperature was recorded every hour, and the maximum, minimum, and average temperatures were calculated for each day.
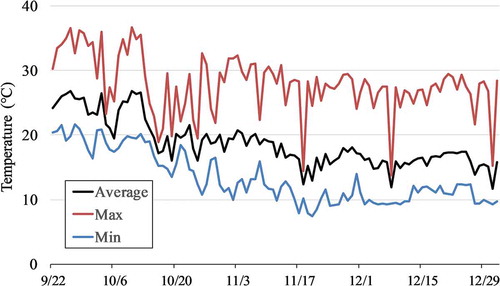
Figure 3. Nutrient solution absorption amount during cultivation. Data are expressed as mean ± SD (n = 6). * and ** indicate significant differences at the 5% and 1% levels for unpaired t-tests.
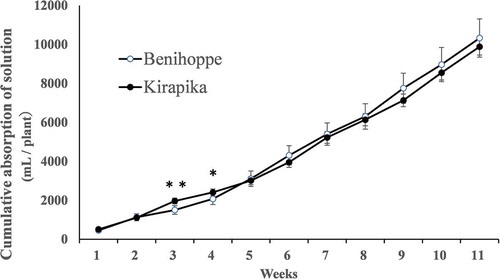
Figure 4. Nutrient solution pH after one week of cultivation. The pre-cultivation nutrient solution was pH 5.5. Data are expressed as mean ± SD (n = 6). Different superscript letters indicate significant differences determined by Tukey’s multiple-range test (p < 0.05).
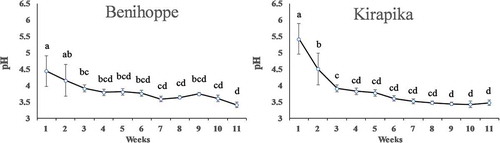
Figure 5. Nutrient solution electrical conductivity (EC) after one week of cultivation. The EC of the pre-cultivation nutrient solution was 750 μs/cm. Data are expressed as the mean ± SD (n = 6). *, **, *** indicate significant differences at the 5%, 1%, and 0.1% levels for unpaired t-tests.
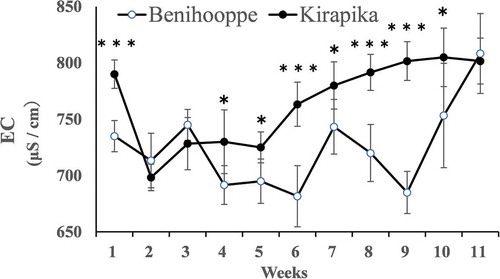
Table 2. Weights of seedlings at planting and of plants and fruits after harvesting of the first fruit cluster.
Figure 6. Plant weight during cultivation. Plant weight includes immature fruit weight. Data are expressed as mean ± S.D. (n = 6). *, **, *** indicate significant differences at the 5%, 1%, and 0.1% levels in unpaired t-tests.
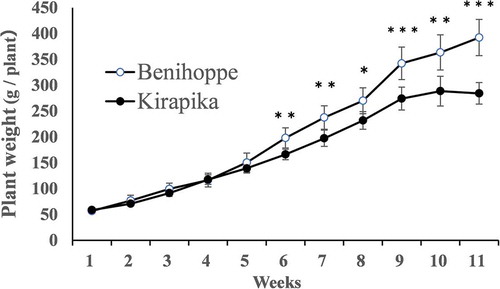
Figure 7. Cumulative levels of ammonium, nitrate, and various nutrients absorbed by strawberry plants during cultivation. Data are expressed as mean ± SD (n = 6). *, **, and *** indicate significant differences at the 5%, 1% and 0.1% levels for unpaired t-tests. Data show cumulative absorption at each planting time point.
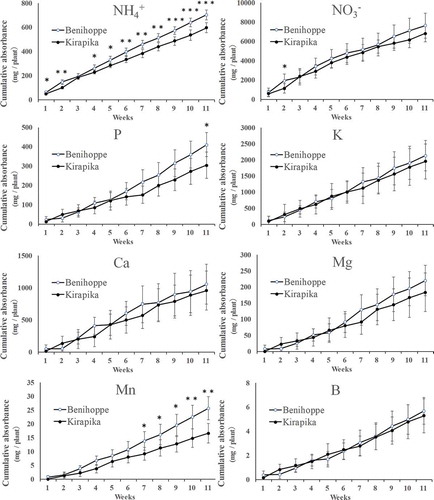
Table 3. Distribution of carbon, fertilizer elements, and trace elements in the plants. Data are expressed as the mean ± SD (n = 6). The concentration of each element per plant organ was tested multiple times using the Tukey-Kramer method for each cultivar. Different letters in each column indicate significant differences at p < 0.05. NS and *, **, and *** indicate not significant and significant differences, respectively, between cultivars at p < 0.05, p <0.01, and p <0.001 by unpaird t-test. DW, dry weight.
Table 4. Increase in the amount of each nutrient in each plant part during plant growth. NS and *, **, and *** indicate not significant and sighnificant differences, respectively, between cultivars at p < 0.05, p < 0.01, and p < 0.001 by unpaired t-test.
Table 5. Extent of the decrease in each element in the nutrient solution and increase in each element in the plant during cultivation.