Figures & data
Table 1. Selected physicochemical properties of the air-dried Brown Forest soil examined in this study and used in our previous report (Kumeta et al. Citation2018).
Figure 1. Relationship between contents in soil and ratios of peaks detected by GC/MS analysis of GlcNAc (left) and (GlcNAc)2 (right). The averages of measured contents of standard soil samples prepared in triplicate are plotted. The result of linear approximation is shown by a formula with its determination coefficient.
Figure 2. GlcNAc and (GlcNAc)2 contents in the incubated upland soil supplemented with 0.2% (w/v) GlcNAc (right), (GlcNAc)2 (middle), and chitin (right). GlcNAc contents, circles; (GlcNAc)2, triangles. Soil samples were prepared in duplicate and the average contents are shown. Error bars indicate the maximum and minimum contents of the duplicated soil samples.
Figure 3. Chitinase (a) and N-acetylglucosaminidase (GlcNAcase) (b) activity in incubated upland soil supplemented with 0.2% (w/v) N-acetylglucosamine (closed circles), N,N’-diacetylchitobiose (closed triangles), powdered chitin (closed squares), or without supplementation (open circles). GlcNAcase and chitinase activities were measured using 4-methylumbelliferyl-N-acetylglucosaminide and 4-methylumbelliferyl-N,N’-diacetylchitobioside, respectively. Soil samples were prepared in duplicate and the average enzymatic activities are shown. Error bars indicate the maximum and minimum activities of the duplicated soil samples.
Table 2. Carbon source utilization by type strains of Paenibacillus and Bacillus.
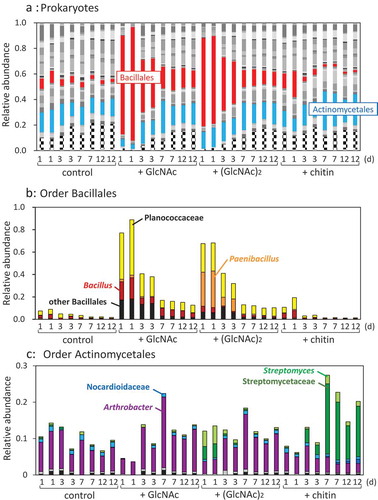
Figure 4. Abundance ratio of Prokaryote orders (a), the order Bacillliales (b), and the order Actinomycetales in the upland soil incubated with GlcNAc, (GlcNAc)2, or powdered chitin. Bacterial orders accounting for less than 0.01 (1%) were compiled as ‘other bacteria’, which is indicated by stripes in A. (a) Red parts represent the order Bacillales; sky blue, order Actinomycetales. (b) Yellow, family Planococcaceae; orange, genus Paenibacillus; brown, genus Bacillus; black, other Bacillales. (c) Light-green, genus Streptomyces; green, family Streptomycetaceae; sky blue, family Nocaudioidaceae; blue, genus Catellatospora; purple, genus Arthrobacter; gray, genus Phycicoccus; black, family Intrasporangiaceae.