Figures & data
Figure 1. Effects of OsPhyB knockout mutations on the uptake and content of Pi in rice seedlings. (a, b) Quantification of 33P-labeled Pi uptake in wild-type (WT), osphyA-3, osphyB-1, osphyB-2, and osphyA-3 osphyB-2 seedlings grown under Pi sufficient conditions for 5 days and then under Pi sufficient (a) or Pi deficient (b) conditions for 5 days. Data represent mean ± standard deviation (SD) of four biological replicates. (c, d) Pi contents of WT, osphyA-3, osphyB-1, osphyB-2, and osphyA-3 osphyB-2 seedlings grown under Pi sufficient conditions for 5 days and then under Pi sufficient (c) or Pi deficient (d) conditions for 5 days. Data represent mean ± SD of five biological replicates. Different lowercase letters above each bar indicate significant differences between means (P < 0.05; Tukey’s multiple comparison test)
Figure 2. Light wavelength-dependent enhancement of Pi uptake and accumulation in rice seedlings. (a, b) Visualization (a) and quantification (b) of 33P-labeled Pi uptake in WT seedlings grown under Pi sufficient conditions for 5 days, followed by Pi deficient conditions for 5 days, and then treated with white light (WL), red light (RL), far-red light (FRL), blue light (BL), or darkness (D) for 24 h. WL/D, RL/D, FRL/D, and BL/D are seedlings whose roots were covered with aluminum foil during various light treatments; D/WL, D/RL, D/FRL, and D/BL are seedlings whose shoots were covered with aluminum foil during various light treatments. Data represent mean ± SD of four biological replicates. (c) Quantification of 33P-labeled Pi uptake in WT and osphyB-2 seedlings grown under Pi sufficient conditions for 5 days, followed by Pi deficient conditions for 5 days, and then exposed to WL or RL for 24 h. Data represent mean ± SD of four biological replicates. (d) Pi contents of WT seedlings grown under Pi sufficient conditions and WL for 5 days, and then under Pi deficient conditions and WL, RL, FRL, BL, or D for 5 days. Data represent mean ± SD of five biological replicates. In (b–d), different lowercase letters indicate significant differences (P < 0.05; Tukey’s multiple comparison test)
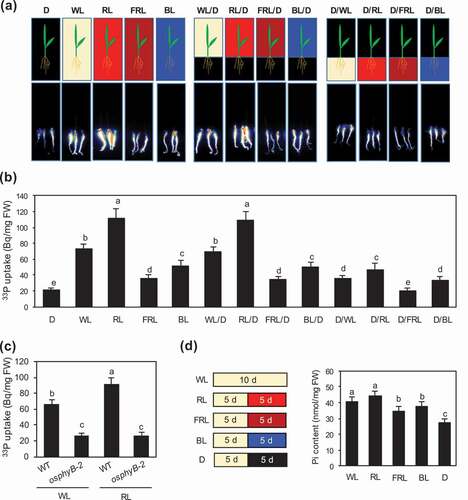
Figure 3. Expression analysis of Pi transporter genes in WT, osphyA-3, osphyB-2, and osphyA-3 osphyB-2 seedlings. (a–f) Expression levels of OsPT1 (a), OsPT2 (b), OsPT3 (c), OsPT4 (d), OsPT6 (e), and OsPT8 (f). Total RNA was prepared from roots of seedlings grown under Pi sufficient conditions for 8 days and then under Pi sufficient (black bars) or deficient (white bars) conditions for 5 days. Gene expression levels were normalized first against OsUBQ5 transcript levels and then against the value obtained from root samples of WT seedlings not treated with Pi deficiency. Data represent mean ± SD of four biological replicates. Asterisks indicate significant differences between mutant and WT seedlings (*P < 0.05, **P < 0.01)
Figure 4. Expression analysis of Pi starvation-responsive genes in WT, osphyA-3, osphyB-2, and osphyA-3 osphyB-2seedlings. (a–i) Expression levels of OsPHR1 (a), OsPHR2 (b), OsPHR3 (c), OsPHR4 (d), OsIPS1 (e), OsIPS2 (f), OsPAP10 (g), OsSQD1 (h), and OsPHO2 (i). Total RNA was prepared from roots of seedlings grown under Pi sufficient conditions for 8 days and then under Pi sufficient (black bars) or deficient (white bars) conditions for 5 days. Transcript levels of genes were normalized first against OsUBQ5 transcript levels and then against the value obtained from root samples of WT seedlings not treated with Pi deficiency. Data represent mean ± SD of four biological replicates. Asterisks indicate significant differences between mutant and WT seedlings (*P < 0.05, **P < 0.01)
Figure 5. RT-qPCR analysis of OsPT1, OsPT6, and OsPHR4 expression in WT, osphyA-3, osphyB-2, and osphyA-3 osphyB-2 seedling exposed to red light. (a) OsPT1; (b) OsPT6; (c) OsPHR4. Total RNA was prepared from the roots of 5-day-old dark-grown seedlings after exposure to red light (RL), far-red light (FRL), blue light (BL), or darkness for 24 h. Transcript levels of genes were normalized first against OsUBQ5 transcript levels and then against the value obtained from the roots of WT seedlings grown in the dark. Data represent mean ± SD of four biological replicates. Asterisks indicate significant differences between mutant and WT seedlings (*P < 0.05, **P < 0.01)
Figure 6. Effect of red light on Pi uptake activity in broccoli, spinach, and lettuce seedlings. Seedlings were grown under Pi sufficient conditions for 5 days, followed by Pi deficient conditions for 5 days, and were exposed to white light (W) or red light (R) for 1 day under Pi deficient conditions. Pi uptake was quantified using 33P-labeled Pi. Data represent mean ± SD of five biological replicates. Asterisks indicate significant differences between WL- and RL-treated seedlings (*P < 0.05, **P < 0.01). NS, not significant