Figures & data
Figure 1. Molecular linkage map of L. japonicus and QTLs (a) Partial molecular linkage map of L. japonicus chromosome 4. Circles containing arrowheads indicate the positions of previously reported QTLs with significant LOD scores: the size of each circle indicates the LOD score, and the direction of each arrow indicates the direction of effect of the B129 allele. SM1 (at 10.6 cM), SM2 (at 9.6 cM), ARA/P (at 9.6 cM) and ARA/NN (7.6 cM) indicate seed mass 1, seed mass 2, acetylene reduction activity per plant, and ARA per nodule number, respectively. (b) Molecular linkage map of L. japonicus and genotype of RI-088 and NIL. Genotype of the RI-088 is shown on the left of the linkage group and the genotype of NIL generated by the cross with RI-088 and B129 is shown on the right. Open circles, filled circles, and filled triangles indicate the genotype of the SSR marker at that position, respectively. Details of the SSR marker can be found on the HP of NBRP Lotus and Glycine
Figure 2. Growth of NILs at 21 days after inoculation with M. loti. (a) Wild-type B129, NILs of B129 type and MG20-type plants. Bar = 1 cm. Arrow heads indicate nodules. (b-e) Shoot length (b), shoot weight (c), root length (d) and root weight (e). B129; n = 75, B129 type, MG20 type; n = 50. Error bars represent standard error (SE). *P < 0.05 by Student’s t-test
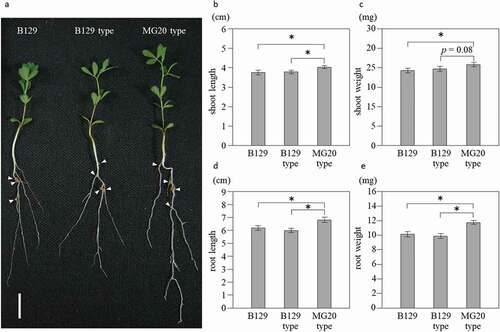
Figure 3. Nodules and ARA of NILs at 21 days after inoculation with M. loti. (a) Nodules formed on root of Wild-type B129, NILs of B129 type and MG20 type. Bar = 2 mm. (b-e) Nodule number per plant (b), Nodule weight per plant (c), ARA per plant (d) and ARA per nodule (e). B129; n = 15, B129 type, MG20 type; n = 10. Error bars represent standard error (SE). *P < 0.05 by Student’s t-test
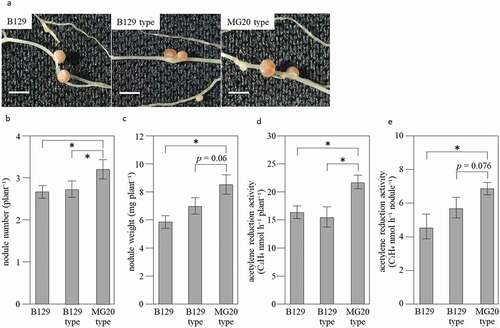
Figure 4. Polymorphism of the amino acid sequence of SEN1 and its effect on the phenotypes. (a) The amino acid sequence of MG20 SEN1 ORF. The 34th amino acid (N, asparagine) is deleted in B129, and transmembrane domains are enclosed in yellow boxes. The transmembrane helix of the membrane protein was predicted by TMHMM Server v. 2.0 (http://www.cbs.dtu.dk/services/TMHMM/). (b) Nodules phenotype with either B129 SEN1 or MG20 SEN1 introduced into sen1-1 mutant at 28 days after inoculation. (c) Acetylene reduction activity per nodule weight. (d) Acetylene reduction activity per nodule. B129 type, MG20 type; n = 22, 24. Error bars represent standard error (SE). *P < 0.05 by Student’s t-test
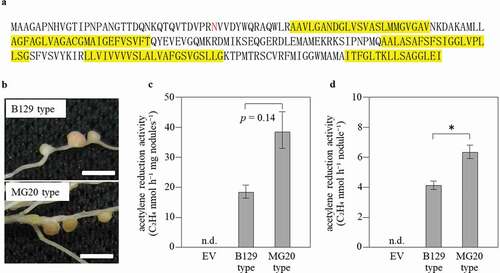
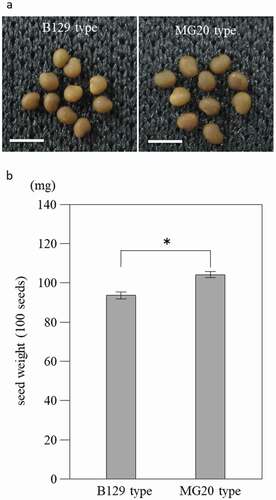
Figure 5. Seeds phenotype from NILs of B129 type and MG20 type. (a) Seeds of B129 type and MG20 type. Bar = 2 mm. (b) Weight per 100 seeds. B129 type, MG20 type; n = 10. Bars represent standard error (SE). *P < 0.05 by Student’s t-test