
Figures & data
Figure 1. Monthly maximum and minimum air temperature, and monthly precipitation at the Lopburi Seed Research and Development Center from 2011 to 2015
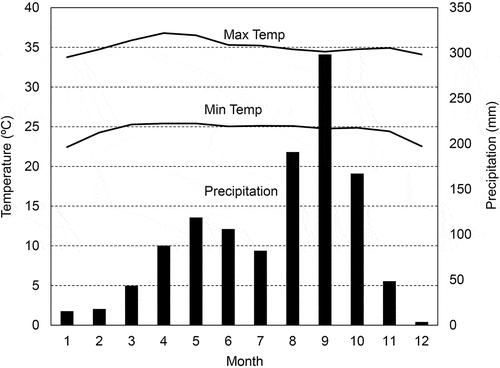
Table 1. Field experiment treatments from 2011 to 2015
Table 2. Crop dry matter production from 2011 to 2015
Table 3. Three-way ANOVA in SOC change from 2011 to 2015 in the experiment in Lopburi
Table 4. SOC change, organic C input, and ratio of SOC stock change per total organic C input to soil from 2011 to 2015 in the experiment in Lopburi