403
Views
2
CrossRef citations to date
0
Altmetric
Plant nutrition

Exploration of unknown nickel-containing proteins from plants by liquid chromatography–inductively coupled plasma mass spectrometry

, , , &
Pages 114-119 | Received 29 Jul 2020, Accepted 02 Dec 2020, Published online: 14 Dec 2020

Figures & data

Figure 1. A scheme of the system used for size-exclusion chromatography (SEC) and anion-exchange chromatography (AEC) coupled with inductively coupled plasma mass spectrometry (ICPMS). Eluents: 50 mM Tris-HNO3 (pH 7.4) for SEC; 20 mM Tris-CH3COOH (pH 8.0) and a mixture of 20 mM Tris-CH3COOH (pH 8.0) and 1 M CH3COONH4 (pH 8.0) for AEC. The guard column was used only for SEC

Figure 1. A scheme of the system used for size-exclusion chromatography (SEC) and anion-exchange chromatography (AEC) coupled with inductively coupled plasma mass spectrometry (ICPMS). Eluents: 50 mM Tris-HNO3 (pH 7.4) for SEC; 20 mM Tris-CH3COOH (pH 8.0) and a mixture of 20 mM Tris-CH3COOH (pH 8.0) and 1 M CH3COONH4 (pH 8.0) for AEC. The guard column was used only for SEC

Figure 2. Analysis of Ni-containing proteins by size-exclusion chromatography–inductively coupled plasma mass spectrometry (SEC-ICPMS). Water-soluble-proteins extracted from the roots of Arabidopsis thaliana grown in hydroponic culture were fractionated and analyzed by SEC-ICPMS. Data for the wild type (Col-0) and the urease-defective mutant (ure) are shown in the upper and lower panels, respectively. The retention times for protein standards are indicated by arrows (urease, 480 kDa; catalase, 245 kDa; superoxide dismutase 1, 32.5 kDa). Analyses were repeated three times for Col-0 and twice for ure, and representative chromatograms are shown

Figure 2. Analysis of Ni-containing proteins by size-exclusion chromatography–inductively coupled plasma mass spectrometry (SEC-ICPMS). Water-soluble-proteins extracted from the roots of Arabidopsis thaliana grown in hydroponic culture were fractionated and analyzed by SEC-ICPMS. Data for the wild type (Col-0) and the urease-defective mutant (ure) are shown in the upper and lower panels, respectively. The retention times for protein standards are indicated by arrows (urease, 480 kDa; catalase, 245 kDa; superoxide dismutase 1, 32.5 kDa). Analyses were repeated three times for Col-0 and twice for ure, and representative chromatograms are shown

Figure 3. Analysis of Ni-containing proteins by anion-exchange chromatography–inductively coupled plasma mass spectrometry (AEC-ICPMS). Fractions with Ni-containing proteins detected by size-exclusion chromatography–ICPMS (fractions 1–3) were collected and analyzed by AEC-ICPMS. Representative results of three replicates for Col-0 are shown (results for ure are shown in Figure S3). (a) Ni detection. Reproducible peaks are indicated by arrowheads, and peaks corresponding to unbound proteins are indicated by dotted arrows. Signal intensities are expressed in counts per million (CPM). (b) Heatmap showing Pearson’s correlation coefficients for the relationship between Ni and other elements in peaks I–V. Pairs showing highly positive correlation (indicated by a coefficient of ≥0.7) for both Col-0 and ure are indicated in white type. (C) Chromatograms of Ni and other metals for peak III (left) and peaks IV and V (right)

Figure 3. Analysis of Ni-containing proteins by anion-exchange chromatography–inductively coupled plasma mass spectrometry (AEC-ICPMS). Fractions with Ni-containing proteins detected by size-exclusion chromatography–ICPMS (fractions 1–3) were collected and analyzed by AEC-ICPMS. Representative results of three replicates for Col-0 are shown (results for ure are shown in Figure S3). (a) Ni detection. Reproducible peaks are indicated by arrowheads, and peaks corresponding to unbound proteins are indicated by dotted arrows. Signal intensities are expressed in counts per million (CPM). (b) Heatmap showing Pearson’s correlation coefficients for the relationship between Ni and other elements in peaks I–V. Pairs showing highly positive correlation (indicated by a coefficient of ≥0.7) for both Col-0 and ure are indicated in white type. (C) Chromatograms of Ni and other metals for peak III (left) and peaks IV and V (right)

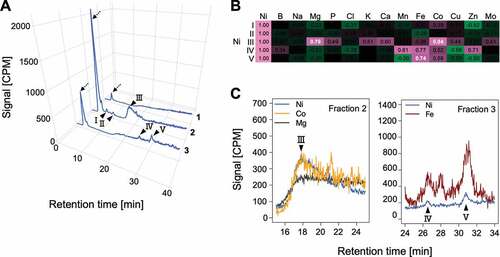
Table 1. Fe-containing proteins identified by liquid chromatography–tandem mass spectrometry in peak V.†.

Reprints and Corporate Permissions

Please note: Selecting permissions does not provide access to the full text of the article, please see our help page How do I view content?

To request a reprint or corporate permissions for this article, please click on the relevant link below:

Academic Permissions

Please note: Selecting permissions does not provide access to the full text of the article, please see our help page How do I view content?

Obtain permissions instantly via Rightslink by clicking on the button below:

If you are unable to obtain permissions via Rightslink, please complete and submit this Permissions form. For more information, please visit our Permissions help page.