Figures & data
Figure 1. Changes in SPAD values from 3 to 5 weeks after sowing with 0, 20, or 1000 µM S. Each value was mean of 10 biological replicates with standard error. Different letters on bars indicate significant differences in SPAD value between S treatments according to Tukey test (P < 0.05)
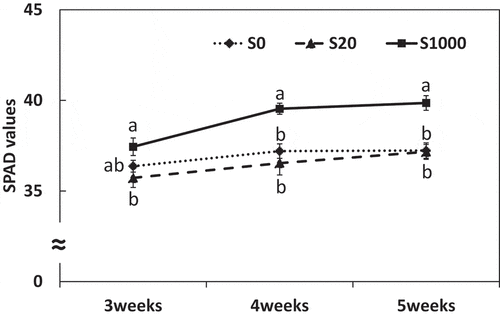
Figure 2. Shoot and root dry weight at 5 weeks after sowing with 0, 20, or 1000 µM S. Each value was mean of 10 biological replicates with standard error. Different letters on bars indicate significant differences between S treatments according to Tukey test (P < 0.05)
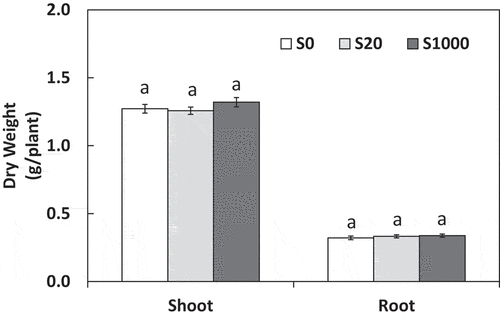
Figure 3. Shoot and root S concentrations (a) and content (b) at 5 weeks after sowing with 0, 20, or 1000 µM S. Each value was mean of 5 biological replicates with standard error. Different letters on bars indicate significant differences between S treatments according to Tukey test (P < 0.05)
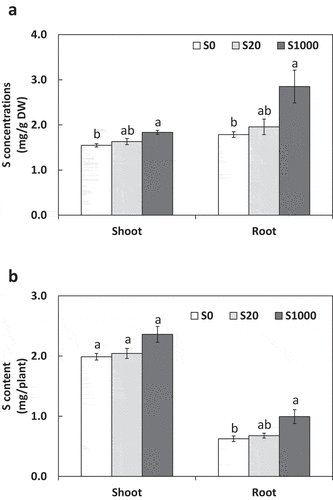
Figure 4. Number of nodules (a) and nodule fresh weight (b) at 5 weeks after sowing with 0, 20, or 1000 µM S. Each value was mean of 10 biological replicates with standard error. Different letters on bars indicate significant differences between S treatments according to Tukey test (P < 0.05)
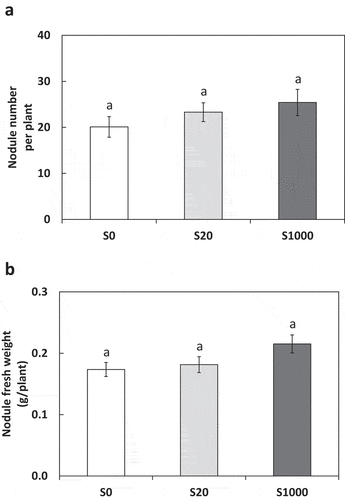
Figure 5. Acetylene reductase activity (ARA) per nodules fresh weight (a) and per plant (b) at 5 weeks after sowing with 0, 20, or 1000 µM S. Each value was mean of 5 biological replicates with standard error. Different letters on bars indicate significant differences between S treatments according to Tukey test (P < 0.05)
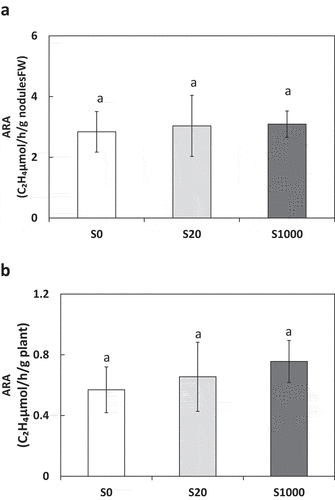
Figure 6. Shoot and root N concentrations (a) and content (b) at 5 weeks after sowing with 0, 20, or 1000 µM S. Each value was mean of 5 biological replicates with standard error. Different letters on bars indicate significant differences between S treatments according to Tukey test (P < 0.05)
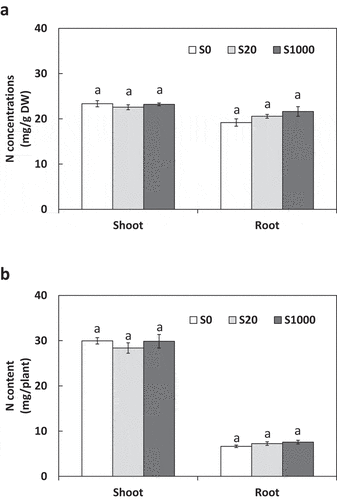
Figure 7. Organic acid concentrations (a) and content (b) secreted from roots 5 weeks after sowing in treatments with 0, 20, or 1000 µM S. Each value was mean of 4 biological replicates with standard error. Different letters on bars indicate significant differences in organic acid content between S treatments according to Tukey test (P < 0.05)
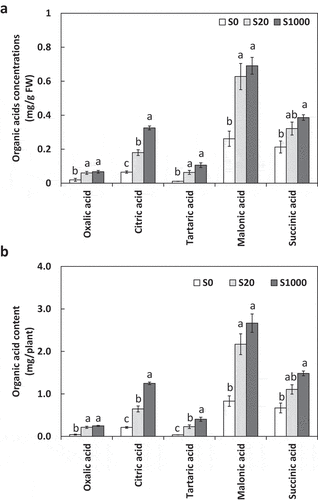
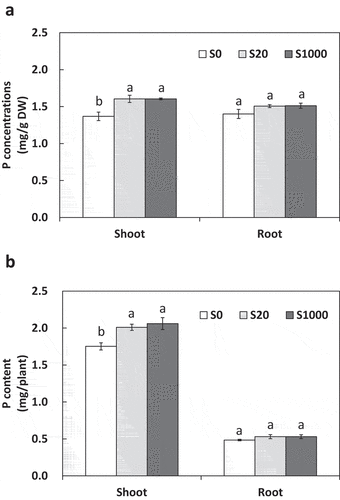
Figure 8. Shoot and root P concentrations (a) and content (b) at 5 weeks after sowing with 0, 20, or 1000 µM S. Each value was mean of 5 biological replicates with standard error. Different letters on bars indicate significant differences between S treatments according to Tukey test (P < 0.05)