Figures & data
Table 1. Selected physicochemical properties of the air-dried Brown Forest soil examined in this study and also used in our previous report (Kumeta et al. Citation2018)
Figure 1. Growth of Fusarium oxysporum f. sp. lycopersici race 1 on an agar medium inoculated with each of the incubated upland soil samples. Area occupancies indicate the rates of sizes of colonies to that of the F. oxyssporum strain on the agar medium without soil suspension. (A) Effect of inoculation of upland soil incubated with LMC60 (middle) or chitin (right) or without supplement (left) for 0 d (white symbols), 3 d (striped symbols), 11 d (light-gray symbols), 45 d (dark-gray symbols) and 60 d (black symbols) at 25°C. (B) Effect of inoculation of upland soil incubated with LMC60 (triangles) or chitin (squares) or without supplement (circles) for 0 d (left), 3 d (middle), and 11 d (right) at 25°C. The panels A and B show the same data rearranged. Averages of triplicate measurements for the duplicate samples are plotted. Error bars indicate the maximum and minimum contents of the duplicated soil samples
Table 2. Contents of (GlcNAc)n (n = 1–5) in LMC60
Figure 2. (A) Thermogravimetric profile of an upland soil supplemented with chitin or LMC60. Alteration of relative weight (%) (normal lines) and rates of decline in weight (dashed line) are plotted. The content of each supplement added to soil was set to 60 g kg−1. (B) Alteration of relative weight (normal lines) and rate of decline in weight (dashed lines) with or without LMC60. The content of LMC60 added to soil (g kg−1) is also indicated. The two straight lines indicate 200 and 370°C. (C) Relationship between the change in weight from 200–370°C and LMC60 content. The averages of triplicate measurements are plotted. Error bars indicate standard deviations. The result of linear approximation is shown by a formula with its determination coefficient
Figure 3. Degradation of chitin and LMC60 in an upland soil. (A) Amount of LMC60 and chitin in incubated upland soil. (B) Amount of ammonium in incubated upland soil supplemented with chitin or LMC60. (C) Activities of chitinolytic enzymes. Circles, control soil (without LMC60 or chitin); triangles, soil supplemented with LMC60; squares, soil supplemented with chitin. In panel C, chitinase activity evaluated with 4MU-(GlcNAc)3 is indicated by open symbols while N-acetylglucosaminidase activity assayed with 4MU-GlcNAc is shown by closed symbols. In panel A, the results of exponential approximation are shown by formulas with the determination coefficients. Soil samples were prepared in duplicate and the average contents are shown. Error bars indicate the maximum and minimum contents of the duplicated soil samples
Figure 4. Number of culturable bacteria (A), fungi (B), and ergosterol content (C) in incubated upland soil without supplements (white bars), with LMC60 (gray bars), and with chitin (black bars). Soil samples were prepared in duplicate and the number of culturable microbes in both soil samples are indicated. Averages of triplicate counts are plotted. Error bars indicate standard deviations
Figure 5. Abundance ratio of bacterial families in upland soil incubated with LMC60 or chitin. Classes accounting for less than 0.01 (1%) were classified as ‘other bacteria.’ Red, Promicromonosporaceae; orange, Streptomycetaceae; blue, Bacillaceae; sky blue, Paenibacillaceae; purple, Alcaligenaceae; green, Xanthomonadaceae
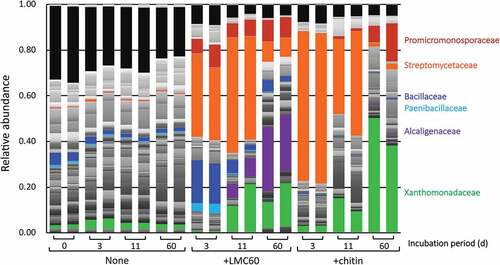
Table 3. Diversity indexes (H’ and D) in LMC60- and chitin-supplemented soils
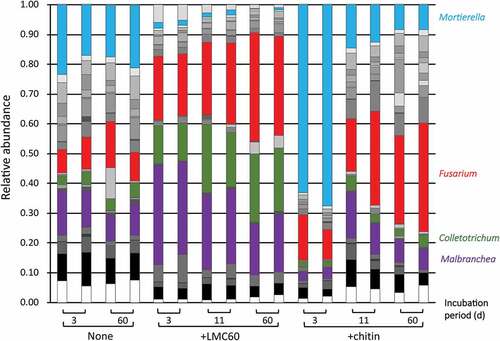
Figure 6. Fungal community structure in upland soil incubated with LMC60 or chitin. Classes accounting for less than 0.01 (1%) were classified as ‘other fungi.’ Sky blue, Mortierella; red, Fusarium; green, Colletotrichum; purple, Malbranchea.