Figures & data
Figure 1. Soil great group distribution map of Hokkaido, Japan (a) and soil group map of the studied region (b). The soil great group and soil group were shown based on the recent update of the soil map in Hokkaido developed with the comprehensive soil classification system of Japan, (Obara et al. Citation2016; Kanda et al. Citation2016)
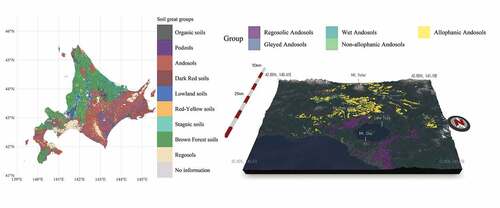
Table 1. CN ratio of organic matters and C application rate via manure, green manure, and combined organic and synthetic fertilizer
Table 2. Soil physicochemical properties
Table 3. Pearson’s correlation matrix of soil physicochemical properties
Table 4. Soil carbon and nitrogen related properties
Figure 2. The relationship between the C application rate via organic matter and SOC stock. Error bar represents a standard deviation
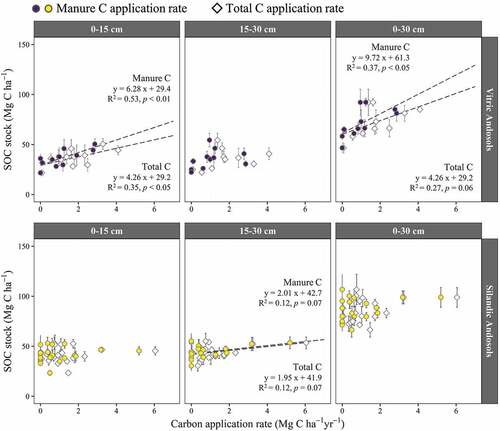
Figure 3. The relationship between the micro-porosity and SOC stock in the 0–0.15 m layer. Error bar represents a standard deviation
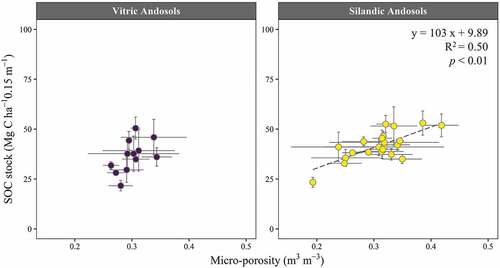
Figure A1. Relationship between sand content and soil physicochemical properties in the 0–0.15 m layer. The error bar represents the standard deviation. SOC: soil organic carbon; STN: soil total nitrogen; CEC: cation exchange capacity
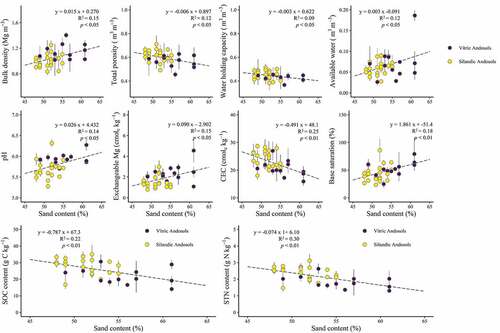
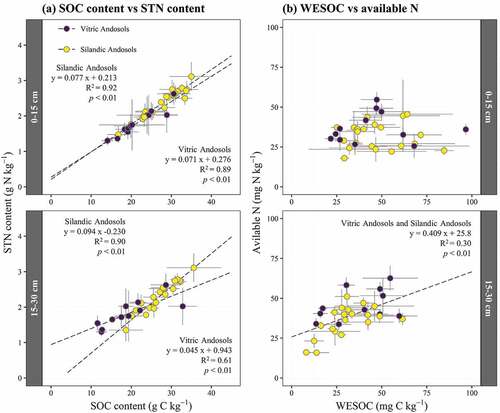
Figure A2. Relationship between (a) SOC content and STN content; (b) WESOC and available N. The error bar represents the standard deviation. SOC: soil organic carbon; STN: soil total nitrogen; WESOC: water extracted soil organic carbon; Available N: Thermal extracted nitrogen suggested by .Sakaguchi, Sakurai, and Nakatuji (Citation2010)