Figures & data
Figure 1. Overview of the study area and sampling locations. The sampling points from the southwest to the northeast are numbered 1–16
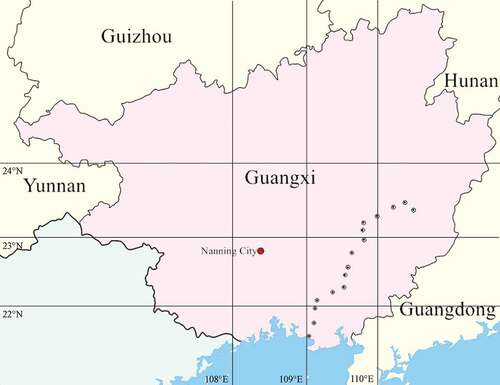
Table 1. The description and determination of the Se types in paddy soil
Table 2. Comparison of soil characteristics between this study and other selenium-rich regions
Table 3. Relationship between the distribution of Se content in different parts of rice plant tissues and soil
Figure 2. Distribution and concentration of Se in rice plant tissues. IQR: interquartile range
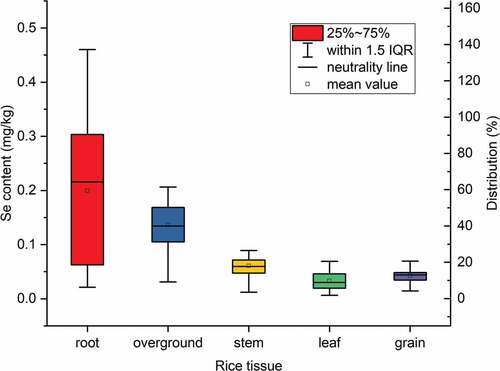
Table 4. Pearson correlation matrix of soil properties, Se concentration in rice plant tissues, and soil Se type in Guangxi
Figure 3. SOM and content of each type of Se in paddy soil of the 16 sampling sites
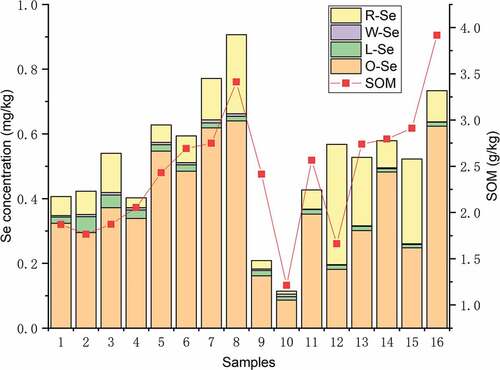
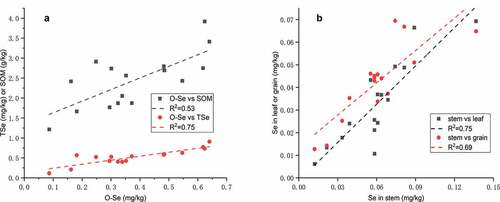
Figure 4. (A) Relationship between TSe, SOM, and O-Se in paddy soil. (B) Relationship between Se content in leaf, grain and stem in rice tissues