
Figures & data
Figure 1. Locations of six experimental plots in a Japanese cool temperate forest (a), and N deposition via throughfall for 6 months (May 9th to November 20th, 2018) in each experimental plot (b). Purple arrows in the top panel represent major wind flows which transport fertilizer from pasture grasslands to our forest. Error bars in bottom panel represent standard deviations (n = 7). The credit of original map data from Google Earth is attributed to Google (CA, USA)
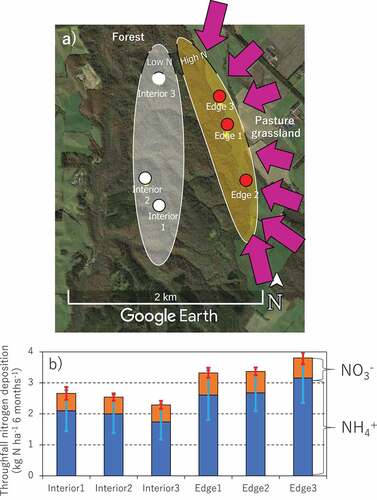
Table 1. Chemical properties of litter and soil (0–5 cm) samples a) and significance of their correlations to N deposition b).
Figure 2. Correlations of net N mineralization and nitrification rates to N deposition. The probability level (p value) for statistical significance examined by two-way ANCOVA was presented above panels. Regression lines (dashed line) and slope values are presented for correlations with p < 0.05
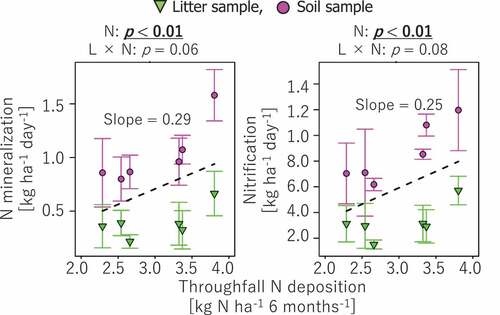
Figure 3. Correlations of microbial biomass C and N and various gene contents, such as bacterial 16S rRNA gene, fungal ITS region, and bacterial and archaeal amoA genes, to N deposition. Statistical analysis of correlation was conducted in the same manner as (see text for details). Regression lines (dashed line) and slope values are presented for correlations with p < 0.05
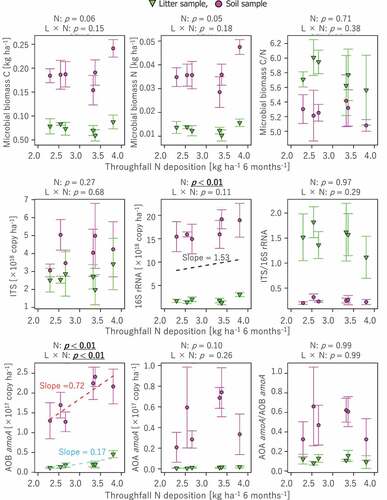
Figure 4. Comparison of fungal and bacterial community structures between Edge 2 and Interior 1 plots and between litter and soil layers. The probability level (p value) for statistical significance examined by perMANOVA was presented above panels. The phyla which individually had less than 1% of proportional composition was binned into other phyla
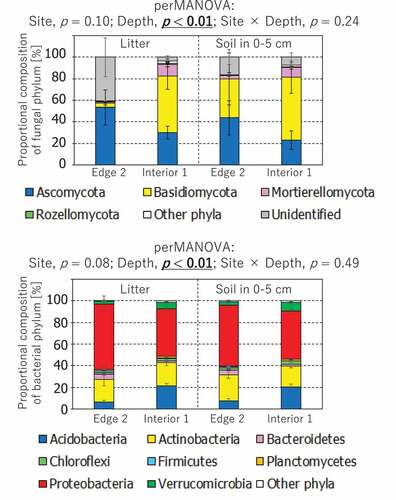
Figure 5. Correlations of soil water content and temperature to N deposition. The presented soil water content and temperature are seasonal means for the observation period from May to November 2018. No significant correlation was observed between N deposition and the environmental factors without any significant difference by t-test (p > 0.05)
Availability of data and material
The Illumina datasets obtained in this study are available at NCBI (National Center for Biotechnology Information) Sequence Read Archive (SRA) under accession number PRJNA612411 (from SRX7906297 to SRX7906320 as the SRA experiment accession numbers). Other data that support the findings of this study are available from the corresponding author upon reasonable request. The codes that process the data of this study are also available from the corresponding author upon reasonable request.