
Figures & data
Figure 1. (a) Soil moisture (%), (b) pH (left) and EC (right; mS m−1) and (c) mineral N (upper: nitrate, lower: ammonium, mg N kg−1 wet soil) contents in disturbed (D) and undisturbed (UD) sites.

Figure 2. ARA of disturbed (D) and undisturbed (UD) soils under aerobic (upper) or anaerobic (lower) conditions with different temperatures.
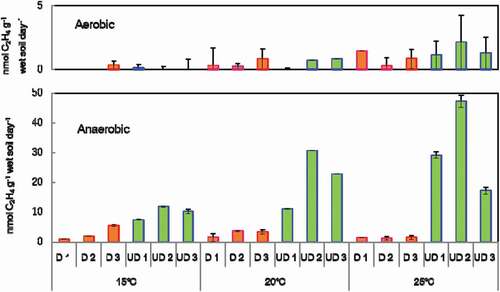
Figure 3. Correlation between ARA and ammonium N of disturbed (D) and undisturbed (UD) soils with different temperatures.
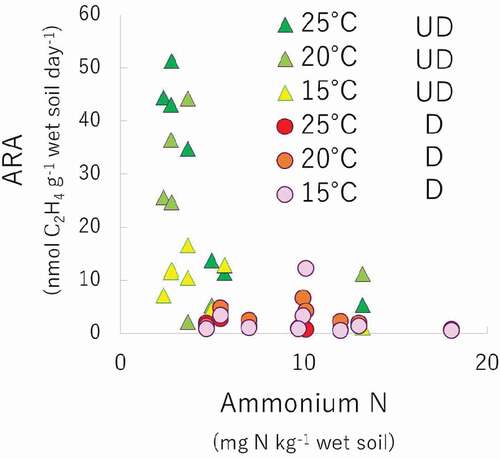
Figure 4. Denitrification activities of disturbed (D) and undisturbed (UD) soils under aerobic (upper) or anaerobic (lower) conditions with different temperatures.
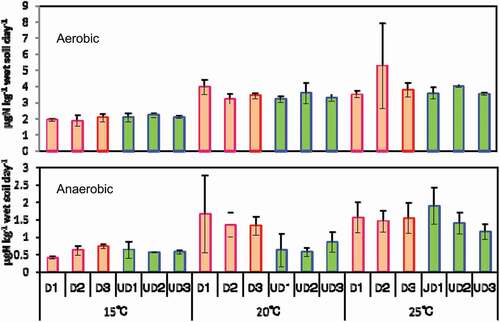
Figure 5. Stable isotope ratios of disturbed (D) and undisturbed (UD) soils.
Table 1. Q10 (25/15°C) of ARA and denitrification activities of disturbed (D) and undisturbed (UD) soils under aerobic or anaerobic conditions
Table 2. Multi-regression analysis of affecting factors for anaerobic ARA in disturbed (D) and undisturbed (UD) soils