Figures & data
Table 1. Physical and chemical properties of the starting soil
Table 2. Chemical characteristics of biochar produced from urban wastes
Table 3. Chemical characteristics of the irrigation water
Table 4. Effects of biochar application on the growth parameters and the physiological parameters of tomato plants grown under salt-stress and non-stress conditions
Figure 1. Effects of biochar application on SOD, CAT, POD activities and proline, H2O2, MDA contents of tomato with and without salt stress. Bars with the same letter do not differ at p ? 0.05 level (Duncan’s multiple range test). Summary of two-way MANOVA for effects of salinity (S), biochar (BC), and their interaction: *Significant at p < 0.05; **Significant at p < 0.01; ***Significant at p ? 0.001; NS: nonsignificant.
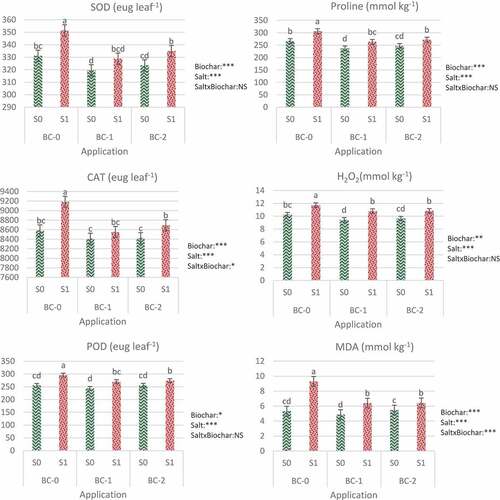
Figure 2. Biplot representation of principal component analysis (PCA) showing the effect of biochar application on tomato plants grown under salt-stress and non-stress conditions. Pl.He: Plant height; SFW: Shoot fresh weight; SDW: Shoot dry weight; Leaf no: Number of leaves; Le.A: Leaf area; RFW: Root fresh weight; RDW: Root dry weight; LRWC: Leaf relative water content; Chla: Chlorophyll a; Chlb: Chlorophyll b; TChl: Total Chlorophyll; H2O2: Hydrogen peroxide; CAT: Catalase; POD: peroxidase; MDA: Malondialdehyde. (Salt Control: Non-saline water, Salt: 100 mM (NaCl), Fert. Control: Sandy loam soil in 3.5-L pots, Fert. Biochar-1: 5% biochar mixed thoroughly with the sandy loam soil prior to filling into 3.5-L pots, Fert. Biochar −2: 10% biochar mixed thoroughly with the sandy loam soil prior to filling into 3.5-L pots.).
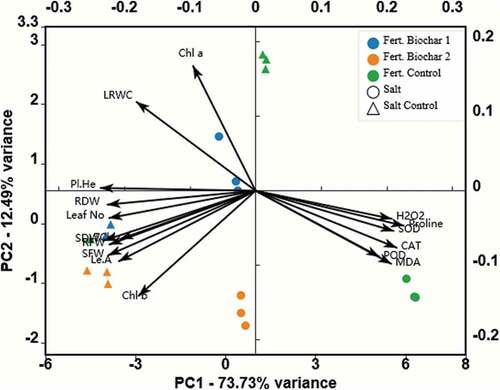
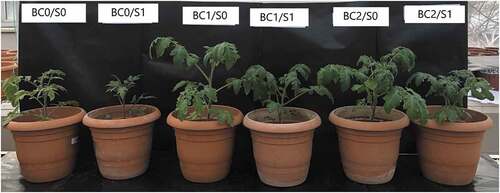
Figure 3. The effect of biochar applications on the growth of tomato plants grown under salt-stress and non-stress conditions. S-0: Non-saline water (as a control), S-1: 100 mM (NaCl), BC-0: Sandy loam soil in 3.5-L pots, BC-1: 5% biochar mixed thoroughly with the sandy loam soil prior to filling into 3.5-L pots, BC-2: 10% biochar mixed thoroughly with the sandy loam soil prior to filling into 3.5-L pots.