Figures & data
Table 1. Details of applications of inorganic fertilizers, organic matter and mineral slags in six treatments
Figure 1. Long-term effects of mineral slag addition on the changes in pH at the 0–25 cm soil depth (a) and 5-cm soil depth increments (b). Bars are standard deviation (n = 3).
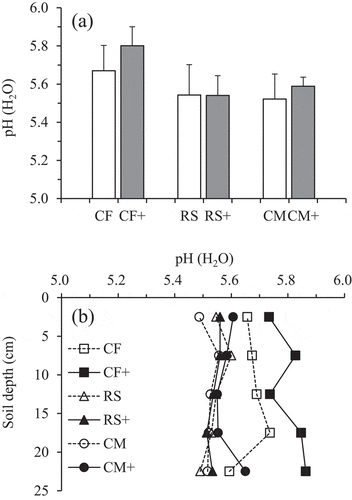
Figure 2. Long-term effects of mineral slag additions on the changes in EC at the 0–25 cm soil depth (a) and 5-cm soil depth increments (b). Bars are standard deviation (n = 3).
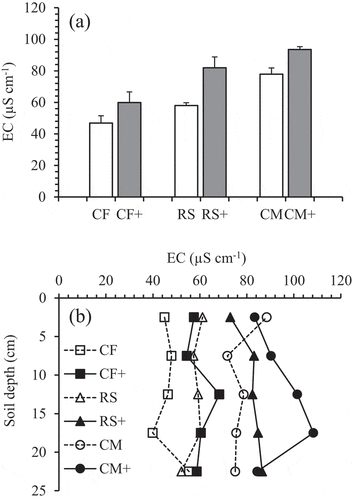
Figure 3. Long-term effects of mineral slag additions on the changes in available P at the 0–25 cm soil depth (a) and 5-cm soil depth increments (b). Bars are standard deviation (n = 3).
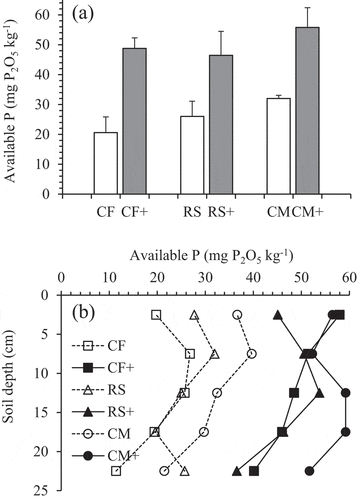
Figure 4. Long-term effects of mineral slag additions on the changes in soil organic carbon at the 0–25 cm soil depth (a) and 5-cm soil depth increments (b). Bars are standard deviation (n = 3).
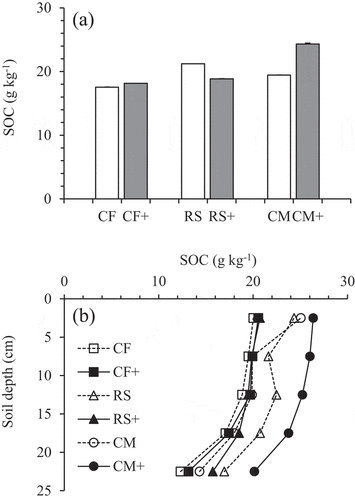
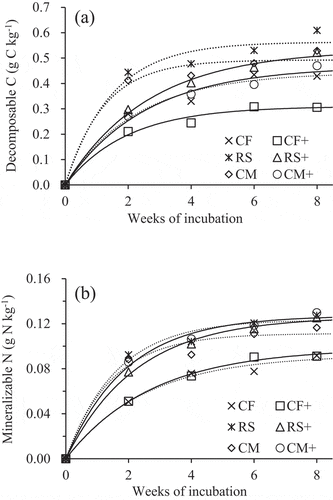
Table 2. The best parameters obtained from the 8-week anaerobic incubation experiment at 30°C for measuring the C decomposition potential (Co) and N mineralization potential (No) for the soil samples from different long-term inorganic fertilizer application treatments at 0−25 cm soil depth. The curves were simulated using the first-order reaction model as
Figure 5. Long-term effects of mineral slag additions on the changes in total nitrogen at the 0–25 cm soil depth (a) and 5-cm soil depth increments (b). Bars are standard deviation (n = 3).
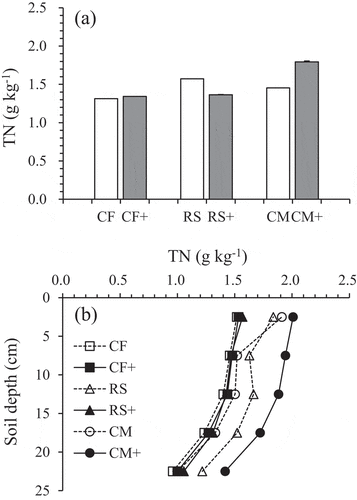
Figure 6. Long-term effects of mineral slag additions on the changes in the C/N ratio at the 0–25 cm soil depth (a) and 5-cm soil depth increments (b). Bars are standard deviation (n = 3).
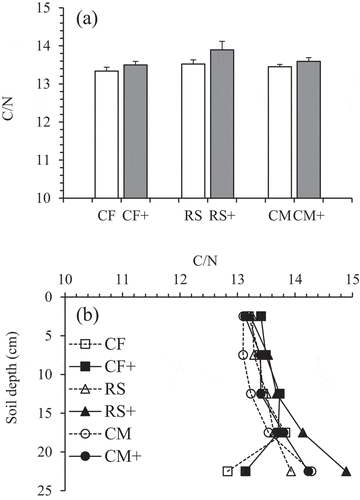
Figure 7. The changes in carbon (C) decomposition (a) and nitrogen (N) mineralization (b) at the 0–25 cm soil depth under anaerobic incubation at 30°C for 8 weeks. Both were simulated by the first-order reaction model as .