Figures & data
Table 1. Soil physical properties among different ages of cocoa plantation
Table 2. Soil chemical properties among different ages of cocoa plantation
Figure 1. Soil carbon stocks among different ages of cocoa plantations. Errors bars show the standard error. The same letters are not significantly different, P<0.05
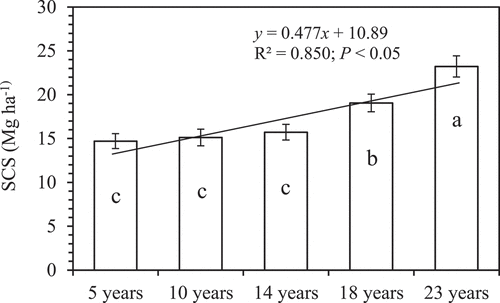
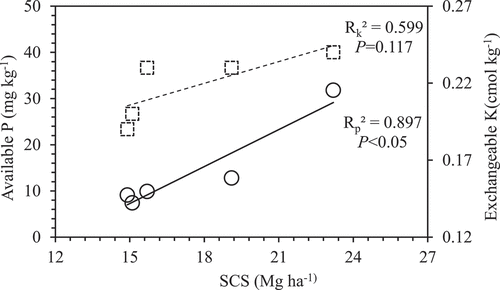
Figure 2. Relationship between SCS and available P◯), and exchangeable K (☐) among different ages of cocoa plantations.