
Figures & data
Table 1. List of VTC protein sequences in arbuscular mycorrhizal fungi and Saccharomyces cerevisiae.
Figure 1. Phylogenetic analysis of VTC proteins in arbuscular mycorrhizal fungi. (a) Domain structures of VTC1, VTC2, and VCT4 in Rhizophagus irregularis. Arrowheads show transmembrane regions predicted by TMHMM search. Scale: 100 amino acids. (b) Maximum likelihood tree of C-terminal sequences containing DUF202 domain of VTC1, VTC2, and VTC4 in eight arbuscular mycorrhizal fungi and Saccharomyces cerevisiae. Bootstrap values (from 100 replicates) greater than 75% are shown next to the branches. Accession no. of VTC protein sequences used in these analyses were listed in . Abbreviations of the species names are: Rhice, R. cerebriforme; Rhicl, R. clarus; Rhidi, R. diaphanus; Rhiir, R. irregularis; Divep, Diversispora epigaea; Gigma, Gigaspora margarita; Gigro, G. rosea; Geopy, Geosiphon pyriformis; Sacce, S. cerevisiae.
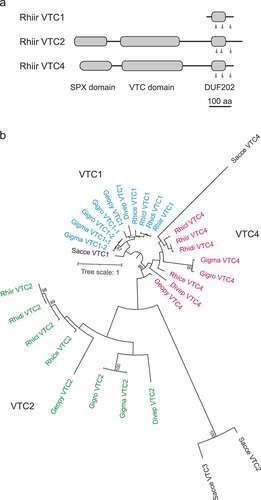
Figure 2. Gene expression analysis of VTC1, VTC2, and VTC4 in extraradical (ERM) and intraradical (IRM) mycelia. The Rhizophagus irregularis EF1β gene was used as an internal control. P-values are based on Welch’s test (n = 3).
Figure 3. Polyphosphate (polyP)-polymerizing reaction of RiVTC4*. (a) Effect of phosphate compounds on the polyP-polymerizing activity. RiVTC4* protein (200 nM) was incubated with 1 mM ATP and various concentrations of orthophosphate, pyrophosphate, tripolyphosphate, and polyP EXP-S for 60 min at pH 6.8. The molar concentration of polyP EXP-S was calculated based on its mean chain length of 14-mer. After stopping the reaction with EDTA, the concentration of ADP was determined. Other experimental conditions were as described in the ‘Materials and methods’ section. One unit (U) is defined as 1 μmol of ADP generated per min; units mg−1 of protein gives the specific activity. Mean ± SD, n = 3. (b, c) Time course of polyP polymerization by RiVTC4*. PolyP was synthesized by incubating 1 μM RiVTC4* with an ATP-regenerating system for the indicated periods. The reaction mixtures contained 1 mM pyrophosphate (b) or 0.1 mM (as phosphate) polyP PP5 with a mean chain length of 37-mer (c). The reaction mixtures were resolved on 33% polyacrylamide gels. PolyP was visualized with DAPI-negative staining. Numbers on the right side indicate chain lengths of the polyP size markers PP4, PP5, and PP6. Chain lengths in parentheses were estimated from the relative mobility of PP4–PP6 in the gel. BPB and Orange G are loading dyes. A representative gel of three independent experiments is shown.
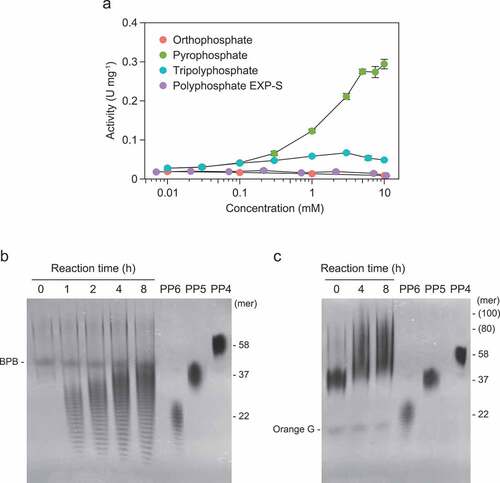
Table 2. Km,Vmax, and kcat values of the forward (polyP polymerization) and reverse (ATP generation) reactions of Rhizophagus irregularis VTC4*
Figure 4. Kinetics of polyphosphate (polyP)-polymerizing reaction of RiVTC4*. (a) Optimum pH of the polyP-polymerizing activity. 1 mM pyrophosphate was included in all cases. Mean ± SD, n = 3. (b) Activation of the polyP-polymerizing activity by divalent metals. The final concentration of each metal ion and EDTA was 1 mM. In all cases, 1 mM pyrophosphate was included. Bars and dots show means and data points, respectively. (c) ATP dependence of the polyP-polymerizing activity in the presence or absence of pyrophosphate (5 mM). The activity was determined, and data were fitted between 0.001–7.5 mM ATP as indicated in the ‘Materials and methods’ section. (d) Inhibition by ADP to the polyP-polymerizing activity of RiVTC4*. RiVTC4* protein (1 μM) was incubated with various concentrations of ADP in the presence of 1 mM ATP and 1 mM pyrophosphate for 4 h. PolyP generated in the reaction mixture was analyzed by 33% polyacrylamide gels. Numbers on the right indicate the mean chain lengths of the polyP markers PP5 and PP6. BPB is a loading dye. A representative gel of three independent experiments is shown.
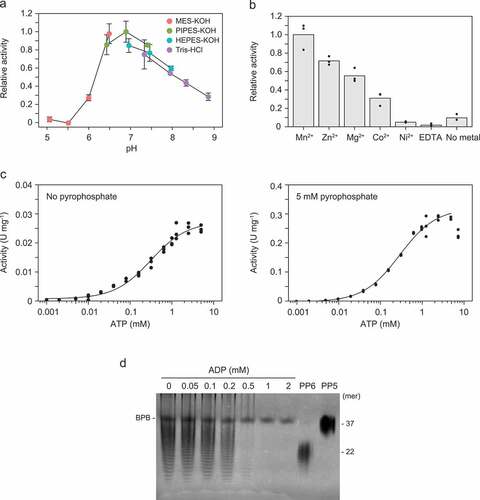
Figure 5. Polyphosphate (polyP)-depolymerizing activity of RiVTC4*. (a–c) Time course of polyP depolymerization by RiVTC4*. Long-chain polyP EXP-L (a) and short-chain polyP EXP-S (b, c) were incubated with RiVTC4* in an ADP-regenerating mixture for the indicated periods. The concentration of polyP was 1 mM (a, b) and 10 mM (c) as phosphate. Other experimental conditions were as described in the ‘Materials and methods’ section. After the reaction, polyP was resolved on 15% (a) or 33% (b, c) polyacrylamide gels (PAGE), and visualized with DAPI-negative staining. DNA markers (DNA) were also resolved to estimate the chain length of polyP according to Smith, Wang, and Morrissey (Citation2018). Mean chain lengths of the polyP size markers PP4 and PP5 were shown on the right side of the gels. BPB is a loading dye. (c) Orthophosphate (P1), pyrophosphate (P2), and tripolyphosphate (P3) were separated by thin-layer chromatography (TLC). M: P1–P3 markers. A representative gel and TLC sheet of three independent experiments are shown.
Figure 6. Kinetics of the reverse reaction (the regeneration of ATP from polyphosphate [polyP]) by RiVTC4*. (a) Optimum pH of the reverse reaction. RiVTC4* protein (100 nM) was incubated with 5 mM ADP and 1 mM polyP EXP-S at various pH levels. After stopping the reaction by heating, the concentration of ATP generated was determined. Other experimental conditions were as described in the ‘Materials and methods’ section. Mean ± SD, n = 6. (b) Activation of the reverse reaction by divalent metals. The final concentration of each metal ion and EDTA was 1 mM. In all cases, 5 mM ADP and 1 mM polyP EXP-S were included. Bars and dots show means and data points, respectively. (c) PolyP (EXP-S) dependence of the reverse reaction in the presence of 5 mM ADP. One unit (U) is defined as 1 μmol of ATP generated per min; units mg−1 of protein denotes the specific activity. The activity was determined, and data were fitted as indicated in the ‘Materials and methods’ section. (d) ADP dependence of the reverse reaction in the presence of 1 mM polyP EXP-S. Data were fitted between 0.25–7.59 mM ADP.
![Figure 6. Kinetics of the reverse reaction (the regeneration of ATP from polyphosphate [polyP]) by RiVTC4*. (a) Optimum pH of the reverse reaction. RiVTC4* protein (100 nM) was incubated with 5 mM ADP and 1 mM polyP EXP-S at various pH levels. After stopping the reaction by heating, the concentration of ATP generated was determined. Other experimental conditions were as described in the ‘Materials and methods’ section. Mean ± SD, n = 6. (b) Activation of the reverse reaction by divalent metals. The final concentration of each metal ion and EDTA was 1 mM. In all cases, 5 mM ADP and 1 mM polyP EXP-S were included. Bars and dots show means and data points, respectively. (c) PolyP (EXP-S) dependence of the reverse reaction in the presence of 5 mM ADP. One unit (U) is defined as 1 μmol of ATP generated per min; units mg−1 of protein denotes the specific activity. The activity was determined, and data were fitted as indicated in the ‘Materials and methods’ section. (d) ADP dependence of the reverse reaction in the presence of 1 mM polyP EXP-S. Data were fitted between 0.25–7.59 mM ADP.](/cms/asset/c256b447-6078-474b-b3be-710f78a425bc/tssp_a_2029220_f0006_oc.jpg)
Figure 7. Effects of ATP and ADP ratios on polyphosphate (polyP) polymerizing and depolymerizing activity of RiVTC4*. RiVTC4* proteins (1 μM) were incubated with various combinations of ATP and ADP in the presence of 1 mM polyP EXP-S for 4 h. Control experiments without enzyme addition (-) were also performed in parallel. PolyP generated in the reaction mixture and the polyP markers PP5 and PP6 were analyzed by 33% polyacrylamide gels. Numbers on the right indicate the mean chain lengths of PP5 and PP6. BPB is a loading dye. Representative gels of three independent experiments are shown.
Supplemental Material
Download PDF (995.3 KB)Data availability statement
The original contributions of this study are included in this article. Further inquiries can be directed to the corresponding author. Data of the alignments and phylogenetic trees of AM fungal VTC proteins are openly available in the Dryad digital repository at 10.5061/dryad.ghx3ffbp7.