
Figures & data
Table 1. Dates of agricultural practices in the experimental field from 2018 to 2020
Figure 1. Seasonal courses of daily mean air temperature and precipitation (a), N2O flux (b), water-filled pore space (WFPS) of the soil at depths of 0–12 cm (c), and NH4- and NO3-N contents of the topsoil (d, e) in the experimental field during the first wheat cultivation period in autumn of 2018 (left) and from spring to summer of 2019 (right). U, CU, CC, and NN indicate the treatments with urea, coated urea, coated calcium nitrate, and no nitrogen applications, respectively. More details of the treatments are described in . The vertical error bars of the N2O flux and soil NH4- and NO3-N contents represent the standard deviations of three replicates. For better clarity of the figures, only the upper halves of the error bars are shown. Data on the WFPS are shown as the mean of all the replicate plots of the four treatments (two sites per plot: 24 sites in total), with error bars as the standard deviations of 24 replicates. For better clarity of the figures, only the upper halves of the error bars are shown. The vertical arrows with ‘BF,’ ‘SF,’ and ‘H’ represent the dates of basal and supplemental fertilizations and the wheat harvest, respectively. Note that the supplemental fertilizations were conducted only in the U treatment.
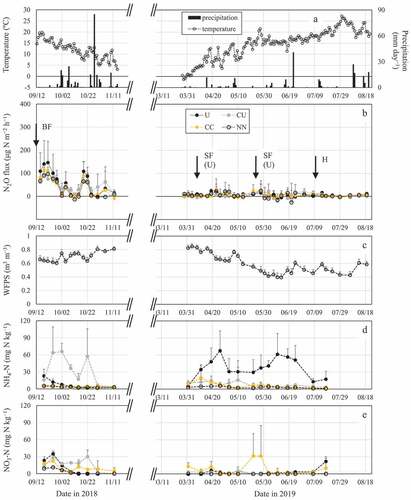
Figure 2. Seasonal courses in daily mean air temperature and precipitation (a), N2O and NO fluxes (b, c), water-filled pore space (WFPS) of the soil at depths of 0–12 cm (d), and NH4- and NO3-N contents of the topsoil (e, f) in the experimental field during the second wheat cultivation period in autumn of 2019 (left) and from spring to summer of 2020 (right). U, CU, CC, and NN indicate the treatments with urea, coated urea, coated calcium nitrate, and no nitrogen applications, respectively. More details of the treatments are described in . The vertical error bars of the N2O and NO fluxes and soil NH4- and NO3-N contents represent the standard deviations of three replicates. For better clarity of the figures, only the upper halves of the error bars are shown. Data on the WFPS are shown as the mean of all the replicate plots of the four treatments (two sites per plot: 24 sites in total), with error bars as the standard deviations of 24 replicates. For better clarity of the figures, only the upper halves of the error bars are shown. The vertical arrows with ‘BF,’ ‘SF,’ and ‘H’ represent the dates of basal and supplemental fertilizations and the wheat harvest, respectively. Note that the supplemental fertilization in April was conducted only in the U treatment, whereas the supplemental fertilization in May was conducted in the U, CU, and CC treatments.
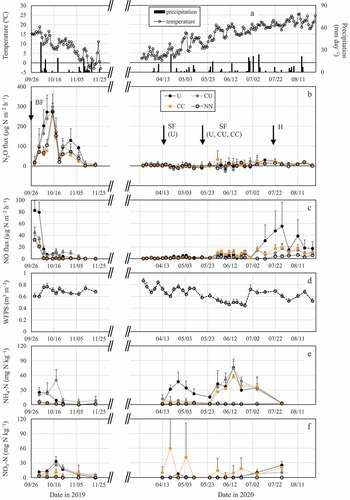
Figure 3. Relationships among N2O flux, water-filled pore space (WFPS) of the soil at depths of 0–12 cm, and daily minimum air temperature in the experimental field with wheat cultivation. The magnitude of N2O flux is proportional to the size (area) of each circle . Data obtained from mid to late autumn after the first N2O flux peak ended (October 2–12 November 2018 and October 21–22 November 2019) are plotted. U, CU, CC, and NN indicate the treatments with urea, coated urea, coated calcium nitrate, and no nitrogen applications, respectively. More details of the treatments are described in .
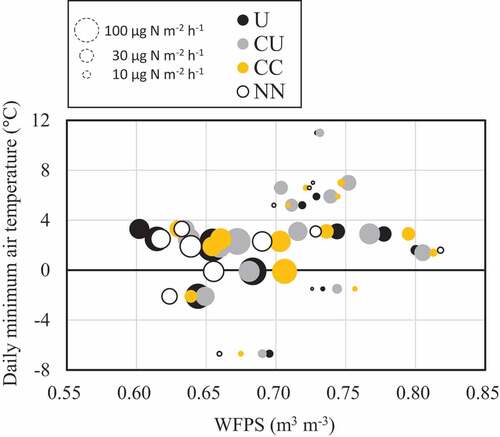
Table 2. Cumulative N2O and NO emissions from the experimental field from 2018 to 2020
Table 3. Grain yield and nitrogen and carbon contents of the wheat in the experimental field from 2018 to 2020
Table 4. Presence of recognizable increase in N2O flux from soils with winter wheat cultivation in Hokkaido reported in previous and present studies