Figures & data
Figure 1. Characterization of the intron retention transcript of GmITPK3. (a) Alignment of RNA-Seq short reads on the GmITPK3 of Natto-kotsubu (Natto) cultivar, normal-phytic acid (NP) line, and low-phytic acid (LP) line. Splicing error between exons 5 and 6 in GmITPK3 of LP line is indicated by an arrow. (b) Transcripts of the non-intron retention (nIR) and intron retention (IR). Gray boxes indicate the exon; thick black lines indicate introns; number indicates the exon number; triangles indicate the positions of in-frame start and stop codons. (c) Expression level (CPM) of the nIR and IR splicing transcript of Natto cultivar, NP line, and LP line leaves. (d) Relative abundance of the nIR and IR splicing transcript of Natto cultivar, NP line, and LP line leaves.
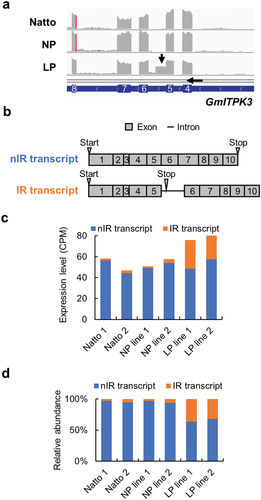
Figure 2. Alternative splicing at the region of exons 5–7 of GmITPK3. (a) Location of primers hybridized for detecting the alternative splicing. (b) Intron retention (IR) transcripts and non-intron retention (nIR) transcripts amplified from cDNA of the Natto-kotsubu (Natto) cultivar, normal phytic acid (NP) line, and low-phytic acid (LP) line leaves (at 27, 31, and 35 cycles of PCR). (c) Schematic representation showing the splicing variants at the region between exons 5‒7 of GmITPK3 according to the cDNA sequencing analysis. The Natto cultivar and NP line gave rise to three transcripts (Natto-IR1, Natto-IR2, and Natto-nIR), whereas LP line showed four transcripts (LP-IR1, LP-IR2, LP-IR3, and LP-nIR). (d) PyMOL generated image of ligand binding residues of each splice variant in the Natto cultivar and LP line predicted by FunFold Server 2. No binding sites were predicted in GmITPK3 translated from Natto-IR1, Natto-IR2, LP-IR1, and LP-IR3. The most likely predicted ligand type of GmITPK3 translated from nIR in the Natto cultivar and LP line was ADP (indicated by red arrow), displaying the ligand binding residues E217, F218, V219, and I321. Meanwhile, the most likely ligand type of truncated protein translated from LP-IR2 was ADP-dependent (indicated by red arrow) and contained F215 as a ligand binding residue. Gray boxes, thick black lines, and numbers indicate exons, retained introns, and exon number, respectively.
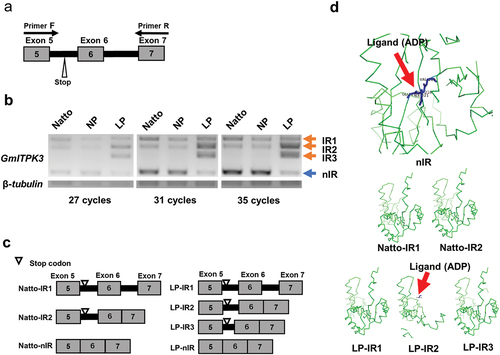
Figure 3. Splicing pattern of GmITPK3 during seed development of the Natto-kotsubu (Natto) cultivar and low-phytic acid (LP) line. (a) Visualization of splicing pattern of developing seed samples in 2% agarose gel. Lane nos. 1‒6 (2‒4 mm), 7‒12 (4‒6 mm), 13‒18 (6‒8 mm), 19‒24 (8‒10 mm), 25‒30 (10‒12 mm), and 31‒36 (12‒14 mm). Each seed length was investigated in triplicate. M indicates the molecular weight marker (50-bp ladder). There were three intron retention transcripts (IR1, IR2, and IR3) and non-intron retention (nIR) in both the Natto cultivar and LP line. (b) The percentage of each transcript in the same lane was calculated from the gel band using ImageJ. The total IR indicate the sum of IR1, IR2, and IR3. Values are presented as means of triplicates and error bars indicate standard deviation. Asterisk indicates significance at p ˂ 0.05 based on the Student’s t-test between the Natto cultivar and LP line at the same seed length.
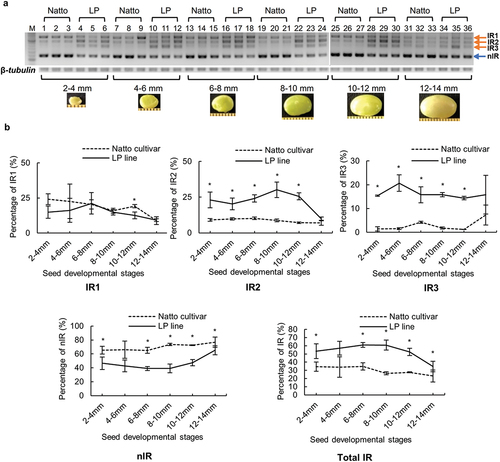
Figure 4. Gene expression level of the inositol 1,3,4 triphosphate 5/6-kinase (GmITPK) family in (a) 21-day leaves and (b) during seed development of the Natto-kotsubu (Natto) cultivar and low-phytic acid (LP) line. Values are presented as the means of triplicates, and error bars indicate standard deviations. Asterisk indicates significance at p ˂ 0.05 based on the Student’s t-test between the Natto cultivar and LP line at the same seed length.
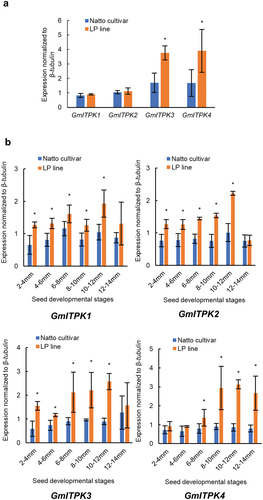
Figure 5. Concentrations of inositol phosphate isomers (InsP6, InsP5, InsP4, and InsP3) during seed development in the Natto-kotsubu (Natto) cultivar and low-phytic acid (LP) line. Values are presented as the means of triplicates, and error bars indicate standard deviations. Asterisk indicates significance at p ˂ 0.05 based on the Student’s t-test between the Natto cultivar and LP line at the same seed length.