Figures & data
Figure 1. The schematic illustrations of the sample holders used in the dispersive (a), Fourier transform (a) and diode-array (b) near-infrared measurements. (a) Sample holder with a sapphire window furnished with a hexagonal aluminum reflector. (b) Open top sample cup for diffuse reflectance measurements. Due to the semitransparency of samples, transflectance may also occur during the spectra acquisition.
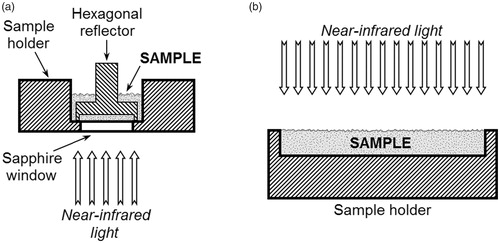
Table 1. Applied data pretreatments.
Figure 2. Raw near-infrared spectra of dispersive (a), Fourier transform (b) and diode-array (c) spectrophotometers for Formulation A and for Formulation B with different nominal active pharmaceutical ingredient concentrations. Due to the higher numbers of heteroatoms and infra-active functional groups of active pharmaceutical ingredient A, dispersive and Fourier transform spectra of Formulation A (a and b, respectively) show stronger characteristic peaks in the 1675–1825 nm region (first overtones of C–H, C=O, N–H and S–H bonds) than the spectra of Formulation B. Diode-array spectra of the two formulations (c) have remarkable differences in the region between 1150 nm and 1250 nm (second overtones of C–H, aromatic C–H, C=C, C=O and O–H bands).
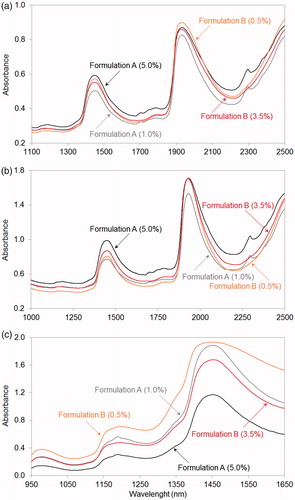
Table 2. Table of root mean square error, correlation coefficient, residual predictive deviation and the number of latent variables of partial least squares regression models, using raw and mathematically pretreated near-infrared spectra.
Figure 3. Regression coefficients of partial least squares regression models, using pretreated spectra of dispersive (a), Fourier transform (b) and diode-array (c) spectrophotometers and standard normal variate normalized second‐derivative spectra of active pharmaceutical ingredients in Formulation A (d) measured with diode-array spectrophotometer. The regression coefficient of diode-array spectra based partial least squares model (c) shows high similarity to the standard normal variate normalized second‐derivative diode-array spectra of the active pharmaceutical ingredient (d). Relevant peaks can be observed in the 1080–1220 nm and 1600–1640 nm regions of regression coefficient of diode-array spectra (c), while these regions of dispersive (a) and Fourier transform (b) spectra based models show little or no relevance.
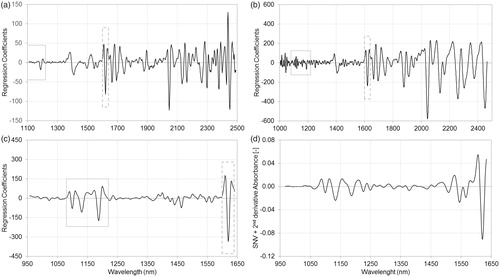
Figure 4. Regression coefficients of partial least squares regression models, using pretreated spectra of dispersive (a), Fourier transform (b) and diode-array (c) spectrophotometers and standard normal variate normalized second‐derivative spectra of active pharmaceutical ingredients in Formulation B (d) measured with diode-array spectrophotometer. The regression coefficient of diode-array spectra based partial least squares model (c) shows high similarity to the standard normal variate normalized second‐derivative diode-array spectra of the active pharmaceutical ingredient (d). Relevant peaks can be observed in the 1110–1160 nm and 1360–1430 nm regions of regression coefficient of diode-array spectra (c), while these regions of dispersive (a) and Fourier transform (b) spectra based models show little or no relevance.
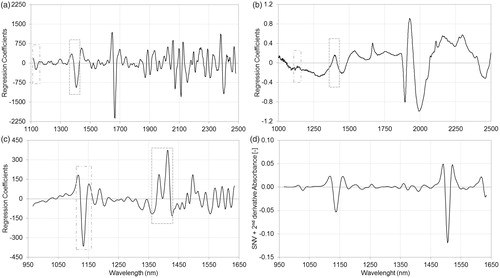
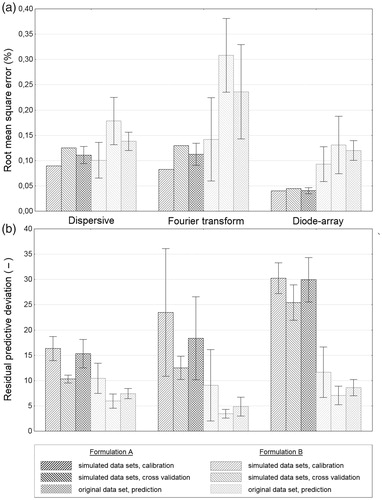
Figure 5. Mean plots with confidence intervals (±0.95) of root mean square error (a), and residual predictive deviation (b) of partial least squares regression models, using original and simulated near-infrared spectra after pretreatments. In the case of both formulations, diode-array spectra gave the best root mean square error (a) and residual predictive deviation (b) results. Calibrations with dispersive and Fourier transform spectra achieved similar results at the analysis of Formulation A, but in the case of Formulation B, Fourier transform spectra could not provide as good calibration as dispersive spectra. See text for more details.