Figures & data
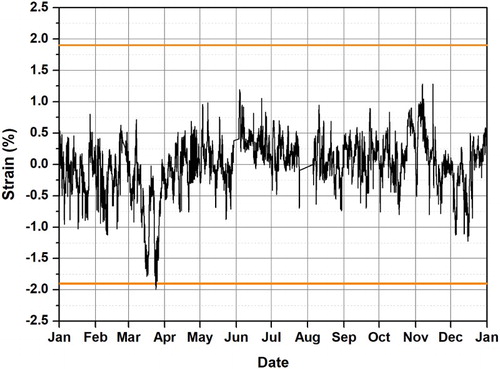
Figure 1. Strain vs. time history (right) experienced by a 0.4 mm thick gesso layer laid on a 10 mm, tangentially-cut wooden panel open to a water vapour flow just through the bare wood surface opposite to the painted face, exposed to RH variations (left) in a gallery in the NMK in 2013. It was assumed in the calculations of strain that no internal stresses were present in the object at the long-term average RH of 45%. The ranges of RH and strain, recommended as safe, are marked with orange lines.
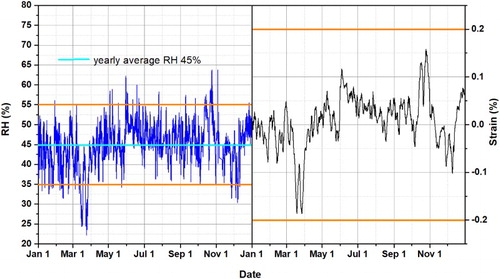
Figure 2. Strain vs. time history as in , induced by an episode in RH fall in March 2013 and simulated for prolonged duration of the low RH condition by one to seven days.
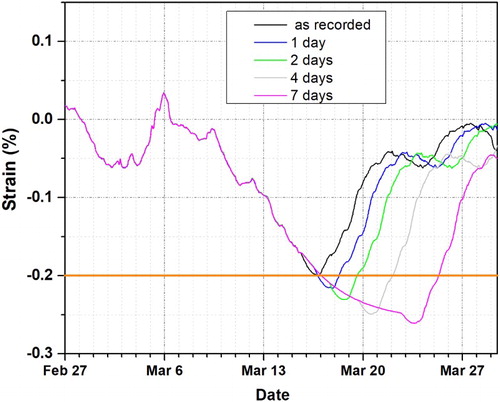
Figure 3. Crack propagation as a function of shrinkage strain experienced by wooden elements in furniture (left). The data were obtained from the AE monitoring using sensors located close to the tips of the existing cracks (right).
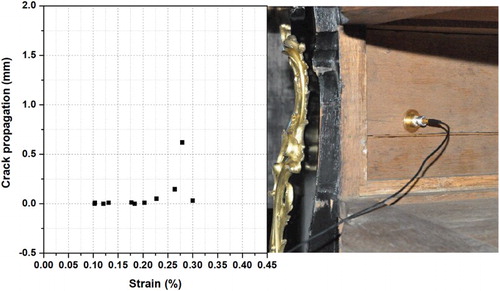
Figure 4. The experimental data for moisture-induced swelling of historical parchment specimens are compared with the average curve calculated from the least-square regression of the data to the second order polynomial.
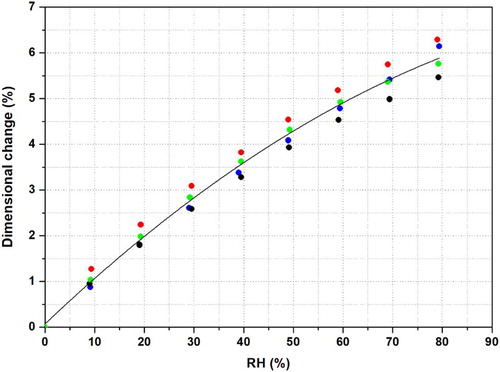
Figure 5. Strain vs. time history experienced by parchment exposed to RH variations as in . The strain range, recommended as safe, is marked with orange lines.