Figures & data
Table 1. Past Reigate stone conservation techniques. Works for which no reference is given are recorded in the archives of Historic Royal Palaces.
Figure 1. Cardinal Wolsey Plaque at HCP showing acceleration of decay rate on wax-treated Reigate stone surface.
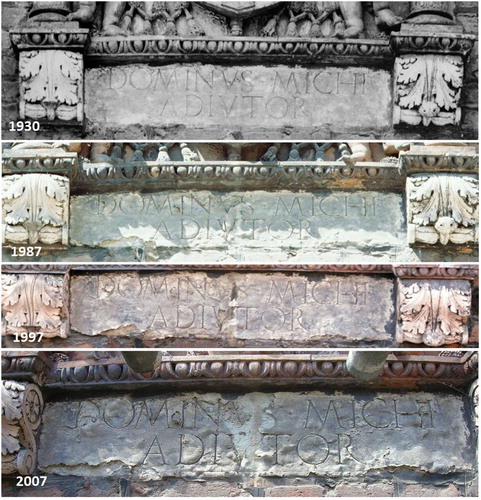
Figure 2. Left: limewashed Reigate stone at Cradle Tower, ToL, shortly after treatment in 1990 and right: in 2018 showing good state of preservation.
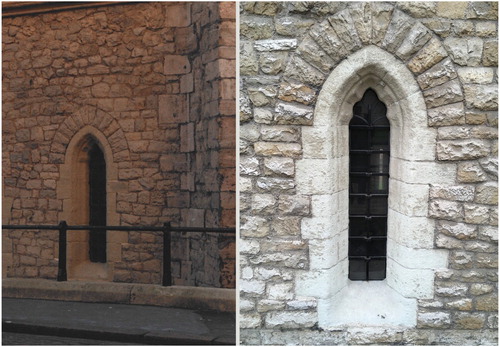
Figure 3. Reigate stone at the Bell Tower, ToL, treated with HCT during the 2001 trials and 2015 conservation work. Greater decay is visible in untreated control (top right), than in stone treated during trial (second row); however, on-going, rapid decay is visible in powdering, darker stones (third row) compared to flaking, lighter stones (bottom row) treated in 2015.
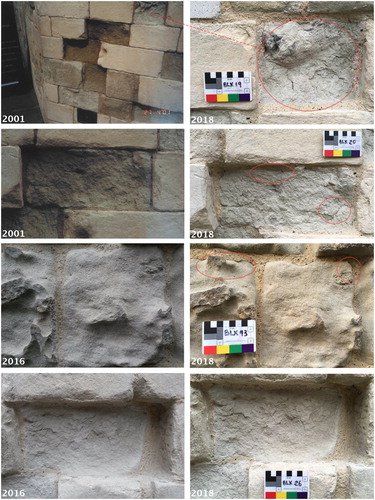
Figure 4. HCT trial wall at ToL. Top: shortly after treatment in 2001 (dark surfaces due to residual moisture following treatment). Middle: individual stones in 2018 (each stone treated on right hand side only). Bottom: micrograph taken with Dinolite USB microscope, showing consolidation of treated surface.
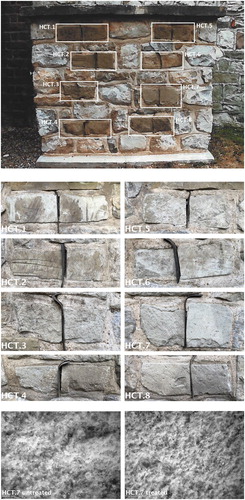
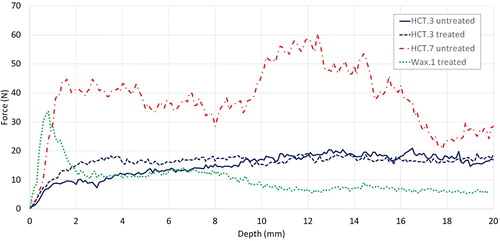
Figure 5. DRM profiles of selected stones.