Figures & data
Table 1. Example statements for each code used to analyse the workshop transcript.
Figure 1. The number of contributions on each topic by each type of speaker.
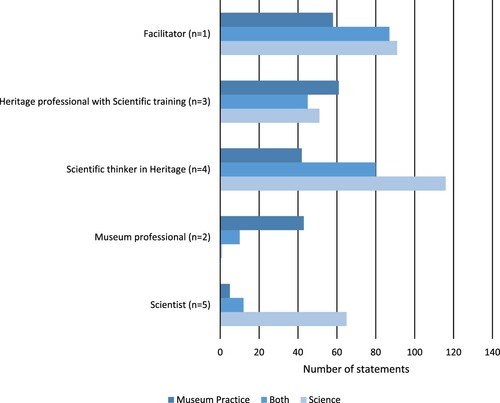
Figure 2. The dynamics of the conversation during the workshop, showing how the topics and speakers changed over time. The colours represent different speaker types, e.g. ‘Scientist’ or ‘Museum Professional’. When these colours appear at the top of the plot, it indicates that the statement made at that time was coded as ‘Museum Practice’, in the middle as ‘Both’, and at the bottom as ‘Science’. The main topics of conversation at any point are indicated along the top of the diagram. The white curve shows how the conversation oscillated between science-focussed and museum-focussed discussions, although always with some element of both.
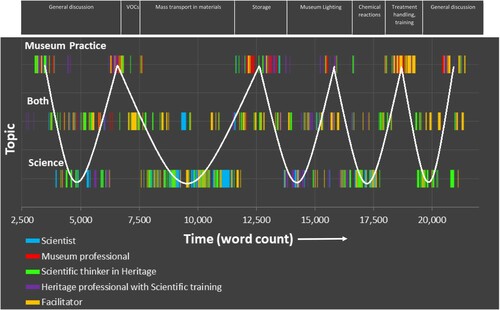
Figure 3. The number of times a member of each different group said something that caused a transition in the topic of conversation.
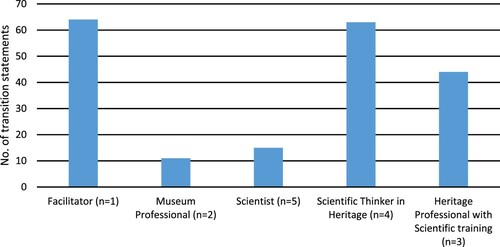
Table 2. An excerpt from the transcript of the workshop showing a transition between a more scientifically focussed discussion on VOC migration and a more museum practice focussed discussion about storage.
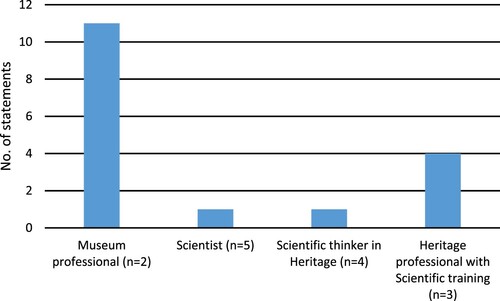
Figure 4. Characteristics identified by the interview participants when asked ‘What do you think it takes for someone to be good at this [making successful transitions in interdisciplinary conversations]?’.
![Figure 4. Characteristics identified by the interview participants when asked ‘What do you think it takes for someone to be good at this [making successful transitions in interdisciplinary conversations]?’.](/cms/asset/ed22dd73-2a96-4636-811c-a33ab7f47008/ysic_a_1875175_f0004_oc.jpg)
Figure 5. (a) The number of references by different groups of participants to processes in or attributes of heritage artefacts at different physical scales during the workshop and (b) The same data shown as percentages for each group.
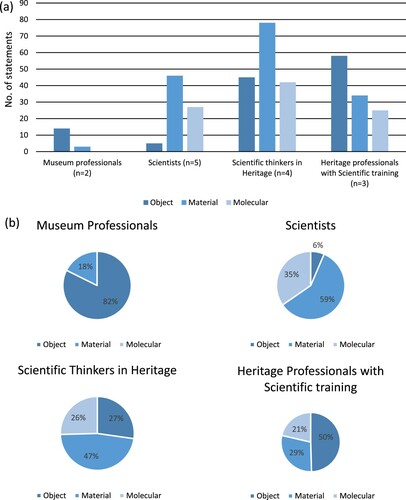
Figure 6. Issues raised by participants that related to the topic of language. Two of these (‘Scientific terminology as a potential barrier to understanding’ and ‘Technical discussions were not a negative experience during the workshop’) relate specifically to the workshop while the others are more general issues raised.
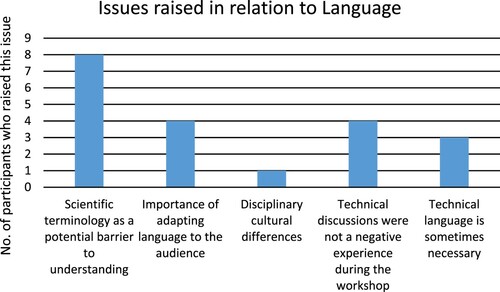
Figure 7. Instances of members of different groups speaking as part of a community.