
Figures & data
Figure 1. Satyr, manufacturer Doccia (Ginori, Italy), second half of the eighteenth century, museum collection Poldi Pezzoli Milan (Italy) before conservation in 1984 (left) and present state (right). Credit: Poldi Pezzoli Museum (1984 and 2012).
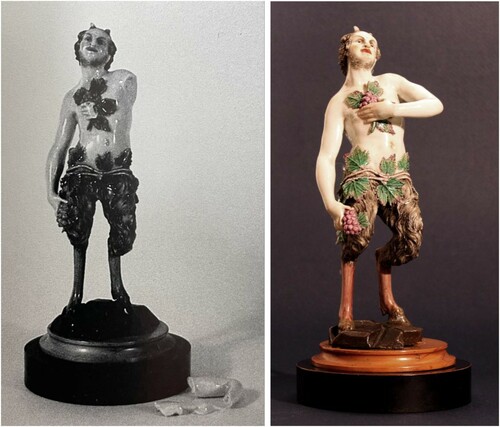
Figure 2. Samples T73, T74, and T75 in 1984, before ageing. Upon visual examination in 1984, all samples appeared transparent.
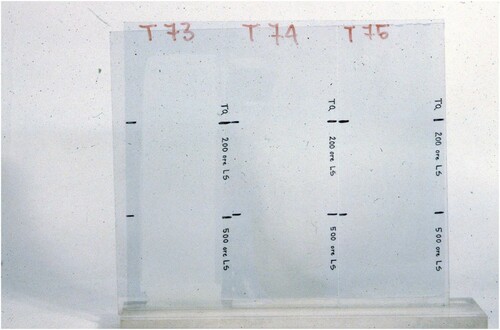
Figure 3. Samples T58, T59, PM9, T74, and T75 with colour chart in 2012 (used in the calibration of all photographs taken in 2012). The samples artificially aged in 1984 are shown here after almost 30 years additional natural ageing.
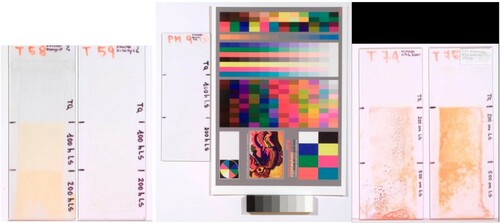
Table 1. Samples and solvents used for the solubility and reversibility methods.
Table 2. Results of the reversibility tests (Method B).
Figure 4. A cellulose nitrate sample artificially aged in 1984, during colour measurement using the microscope Axio Imager.A2m. The area where the colour measurement was taken is marked with a circle. Photograph taken in 2012.
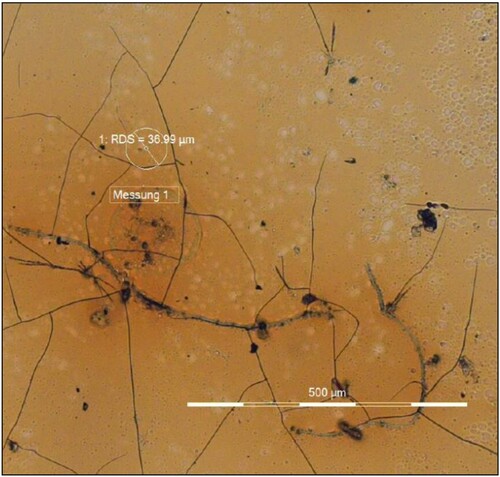
Figure 5. Infrared spectra of the samples T58 (blue), T77 (red), and T59 (orange).
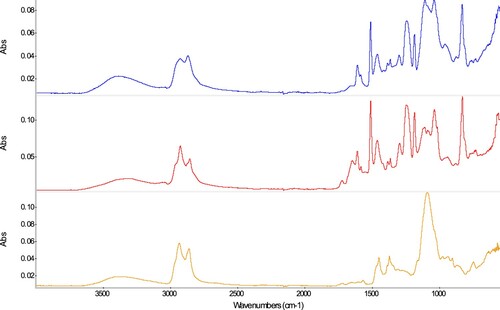
Figure 6. Infrared spectra of samples N80a (red) and PM9 (orange).
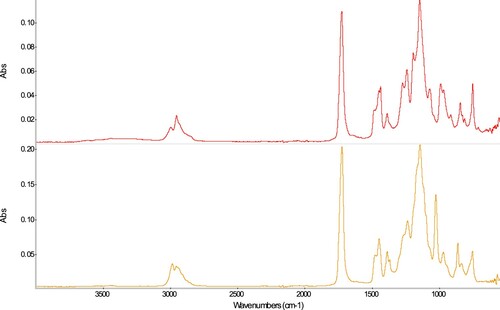
Figure 7. Infrared spectra of samples T67 (green), T70 (pink), T71 (dark purple), and T73 (red).
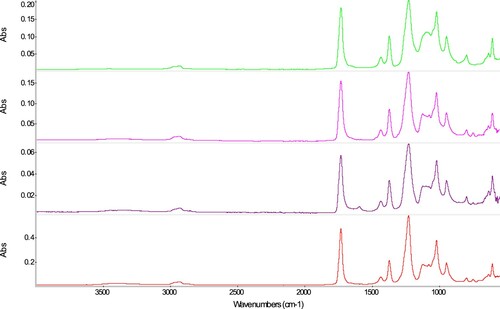
Figure 8. Infrared spectra of samples T74a (blue) and T75a (red).
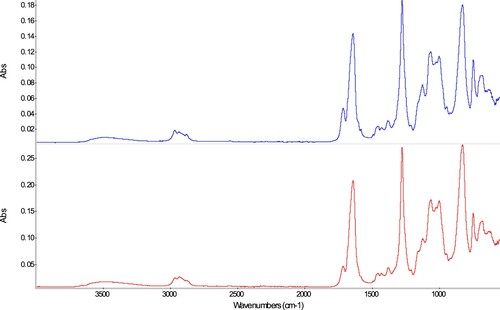
Figure 9. Results of the solubility test (Method A; grey: % SOL and white: % INS; see text and Experimental methods). Different solvents were used for each case (epoxy resins: DCM; acrylates, vinyl acetates, and cellulose nitrates: acetone; see text). The TQ areas were not artificially aged in 1984 but were so when the analyses were carried out in 2012. TQ: not artificially aged, only naturally aged; the numerals 100, 200, and 500 indicate the number of hours of artificial aging undergone by the samples in 1984.
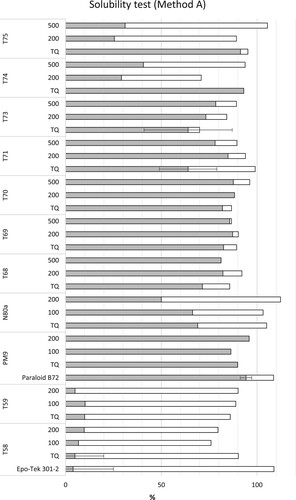
Figure 10. ΔE*ab between TQ and 200 h of the samples from 1984 (white) and 2012 (grey). For samples T74 and T75, the 2012 values are associated with a high error due to the heterogeneity of the samples (see and Experimental section).
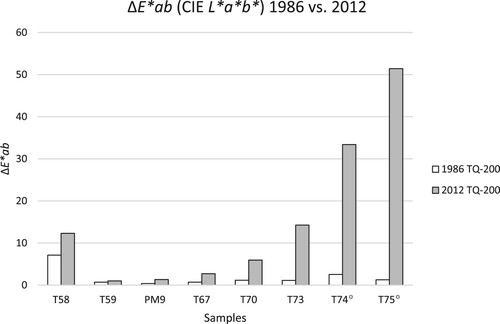
Figure 11. Δb* between TQ and 200 h of the samples from 1984 (white) and 2012 (grey). For samples T74 and T75, the 2012 values are associated with a high error due to the heterogeneity of the samples (see and Experimental section).
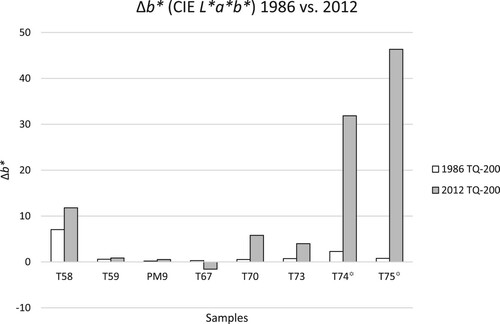
Table 3. Results of the 1984 colour analyses after artificial ageing (100:100 h, 200:200 h, 500:500 h).