Figures & data
Figure 1. Shaft #1 headgear. Upper: Relevant objects for development of the Tsumeb mining site as a national heritage site (Scholz and Frautschy Citation2019, Citation2020). 1, new (Friedrich-Wilhelm) Shaft #1 headgear; 2, DeWet Shaft headgear; 3, main ore conveyer; 4, power plant hall; and 5, mineralogy building. Lower: left, photograph of the old (left) headgear from 1908 and the new (right) Shaft #1 headgear from 1925 (Scholz and Frautschy Citation2019, Citation2020; Jassmann Citation2020); right, Engineering illustration of the new Shaft #1 headgear (Jassmann Citation2020).
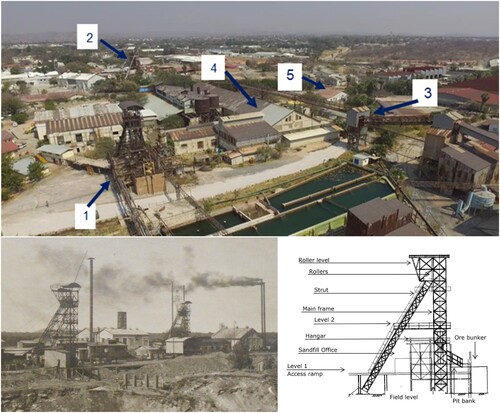
Figure 2. Corrosion phenomena on the steel surface at various regions of the headgear. Upper left: Shaft #1 headgear, overview. Upper right: gusset plate at center main column of Level 2 (south). Lower left: shallow pitting corrosion at a handrail. Lower center: main column at Level 2 (east side) with coating remains. Lower right: ore dust accumulation at the lower column parts.
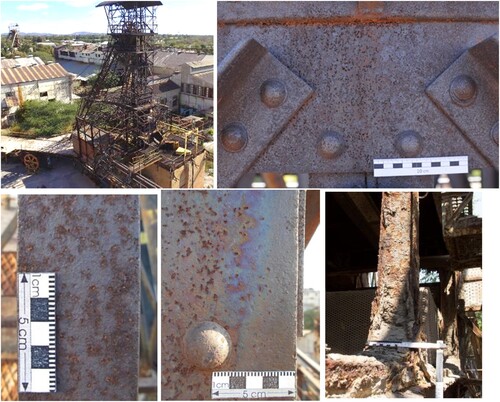
Figure 3. Locations of the specimens taken from the Shaft #1 headgear. Upper left: location of the angular profile. Upper right: location of the flat profile. Lower left: dimensions of the angular profile 60 × 60 × 5 mm. Lower right: dimensions of the flat profile 40 × 8 mm.
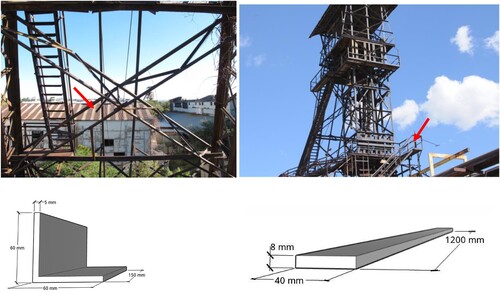
Figure 4. Test coupons after climate chamber testing. Left: test coupon with alkyd resin-based coating at 201 h exposure. Right: coated with alkyd resin-based substance with UV-blocker addition (left) and without (right) – all specimens coated with the UV blocking additive lost luster in the coating after the climate test chamber exposure.
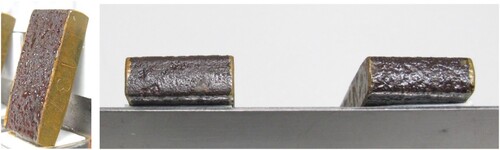
Table 1. Test series for climate chamber exposure and for subsequent potentioscans, all samples were saw-cut and fresh metal edges were coated with a masking varnish.
Figure 5. Samples of Tecero® Wax coating. The right images show the condition on May 2018 (top), November 2018 (middle), and October 2019 (below), respectively.
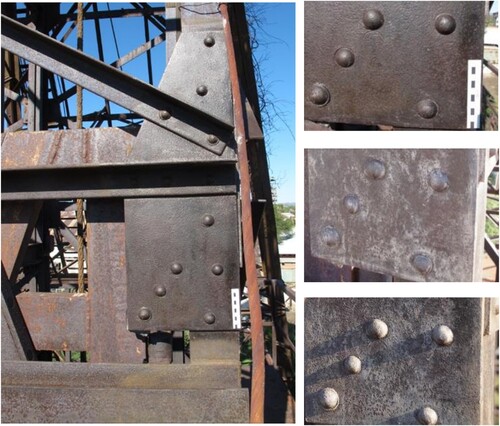
Table 2. Chemical composition (wt.%) of the investigated mild steel specimens (elements of major importance are printed in bold letters), measured by emission spark spectroscopy.
Figure 6. Flowchart for the classification of old steels as puddle or mild steels according to Langenberg (Langenberg Citation1995).
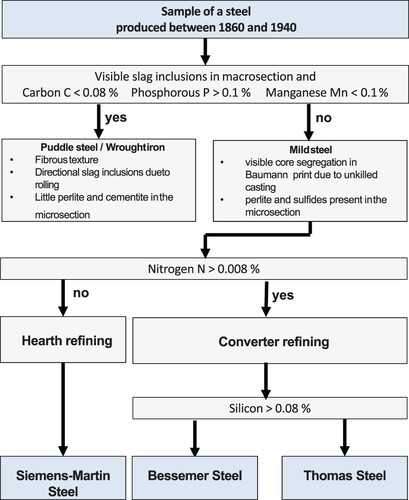
Figure 7. Microstructure of the two steel profiles investigated with scanning electron microscopy (SEM). Upper left: flat profile – cross-section in rolling direction with corrosion layer, low magnification. Upper right: flat profile – cross-section in rolling direction with corrosion layer, high magnification. Lower left: angular profile – cross-section perpendicular to rolling direction with corrosion layer, low magnification. Lower right: angular profile – cross-section perpendicular to rolling direction with corrosion layer, high magnification.
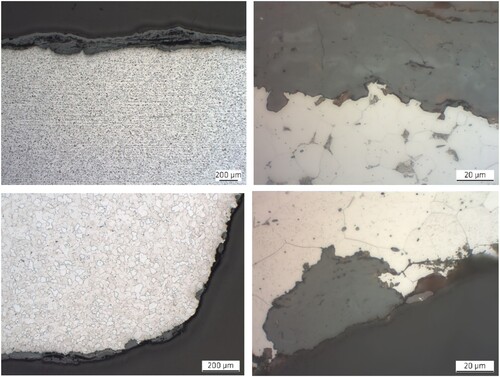
Figure 8. Energy-dispersive X-ray (EDX) mapping of iron and oxygen at region of selective ferrite grain corrosion on the mild steel profile surface. Left: iron content (at.%). Right: oxygen content (at. %).
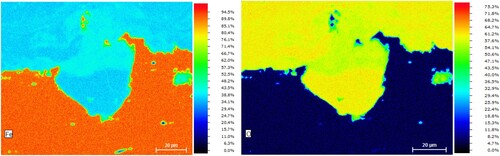
Figure 9. High resolution (HR) SEM images of the corroded flat steel profile surface. Upper: overview of an extensively corroded region (left); close-up exhibiting laminar lepidocrocite (right). Lower: close-up of a less corroded region (left); close-up exhibiting rosette-like goethite (right).
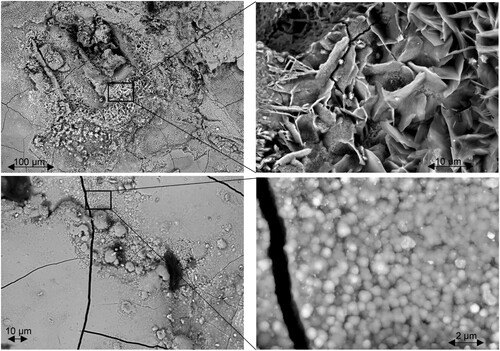
Figure 10. HR-SEM images of the corroded angular steel profile surface. Upper: overview of extensively corroded region (left); close-up exhibiting lamellar lepidocrocite on top of rosette-like goethite (right). Lower: close-up of a less corroded region (left); close-up exhibiting goethite transformed from a rosette-like structure to a more crystalline structure (right).
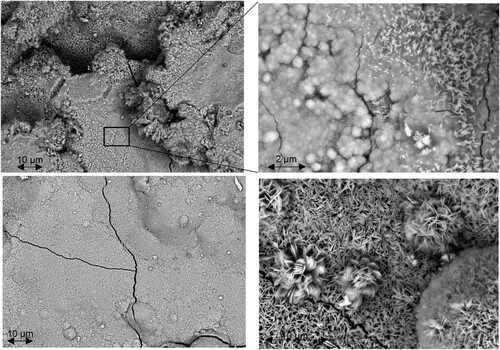
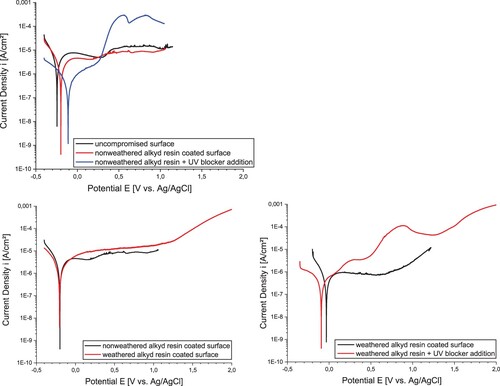
Figure 11. Potentiodynamic diagrams (E–I curves) of the flat profile mild steel surface. Upper: potentiodynamic diagrams of the flat profile mild steel surface in the non-weathered condition. Lower left: I–E curves of weathered (red line) and the non-weathered (black line) alkyd resin coated surface. Lower right: I–E curves of the weathered alkyd resin coated surface and that coated with UV-blocker addition.