Figures & data
Figure 1. A schematic representation of how an agent of change produces damage. Damage is not a straightforward process of cause and effect. Rather, it is the result of a perception that an object’s value and or use has been negatively affected due to changes in state caused by exposure to a given agent of change.
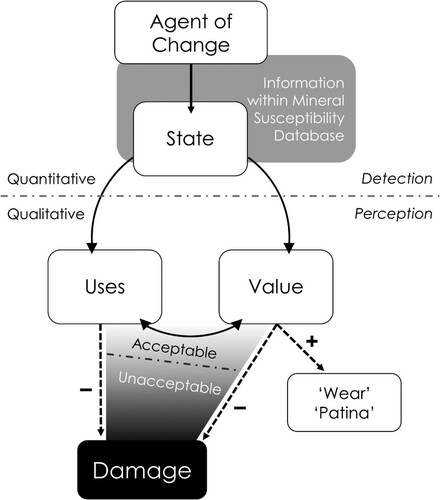
Figure 2. Phase diagram of SiO2 polymorphs. While coesite has the largest stability field of the silica polymorphs, it cannot exist under atmospheric pressure at Earth’s surface, as the structure of α-quartz is energetically preferred. Image used with permission courtesy Akhavan (Citation2014).
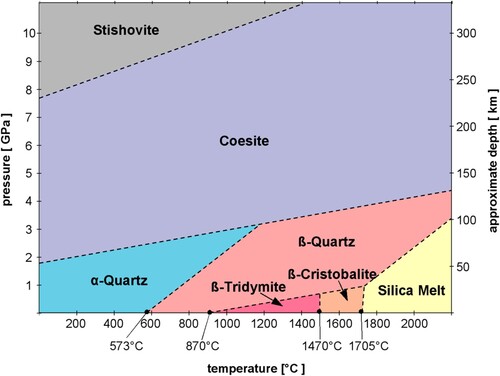
Table 1. A list of reactions that may occur to minerals in a museum environment, their causes, and definitions. Most of these reactions are irreversible, and even those that are reversible can produce permanent change.
Figure 3. A specimen of halite (NaCl; OUNHM MIN.26782), featuring the characteristic rounding of corners and edges, and an opaque matte surface due to deliquescence. Image used with permission of Oxford University Natural History Museum.
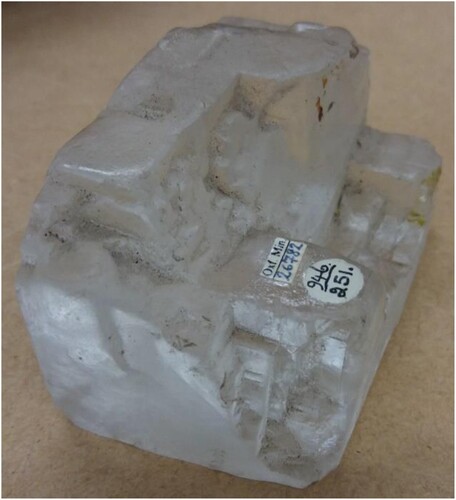
Figure 4. A veinstone specimen affected by pyrite decay. A section has spalled off the body; both feature characteristic yellow and white sulfate efflorescence. Also note the ‘scorching’ of the label, caused by sulfuric acid, which has defaced the accession number. Image courtesy National Museum Cardiff.
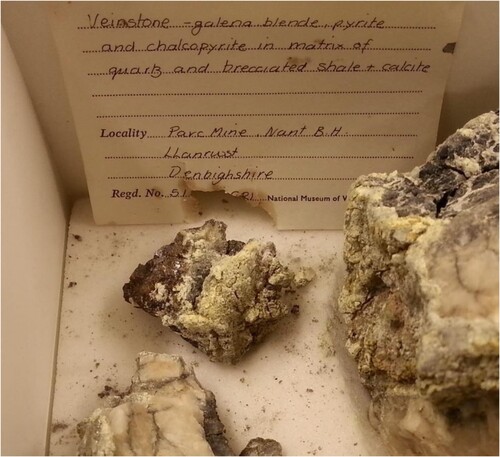
Table 2. Molar volumes of pyrite and some common iron sulfate reaction products, illustrating the increases in molar volume during pyrite oxidation reactions.
Figure 5. A specimen of cinnabar (HgS; OUNHM MIN.15474), displaying a dark, silvery appearance, attributable to the surficial formation of metallic mercury. Image used with permission of Oxford University Natural History Museum.
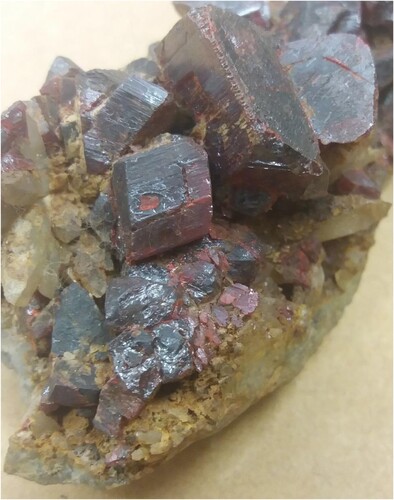
Figure 6. A specimen labelled as domeykite (Cu3As; OUNHM MIN.27550), displaying patches of a dark navy-blue efflorescence and lines of a cocoa brown efflorescence, which have likely formed by the off-gassing of storage material or the deterioration of neighbouring specimens. Image used with permission of Oxford University Natural History Museum.
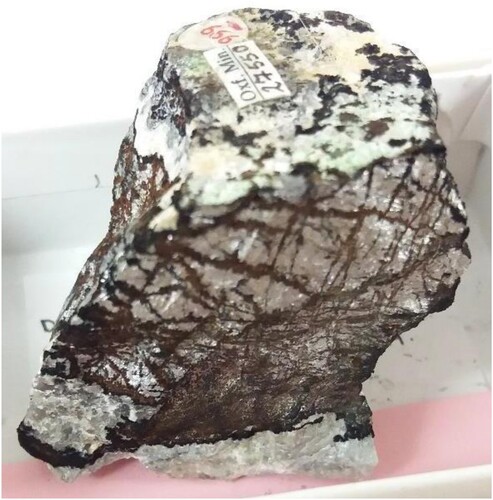
Figure 7. A graphical representation of the distribution of minerals across major mineral groups. The outer ring displays the number of those included in the 3rd edition of Hey’s Chemical Index of Minerals (CIM, see Clark (Citation1993)), while the inner ring shows the number of those included in the Mineral Susceptibility Database (MSD). By comparing the two rings, one can see that certain mineral groups are better represented in the MSD than others.
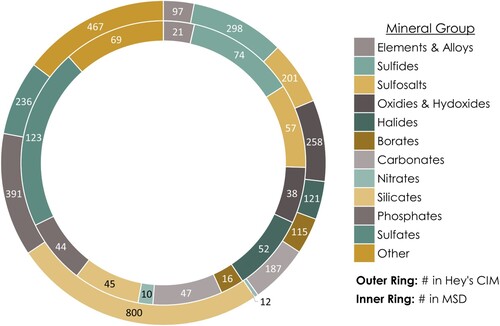
Figure 8. Distribution of susceptibility data entries within the MSD grouped by agent of change.
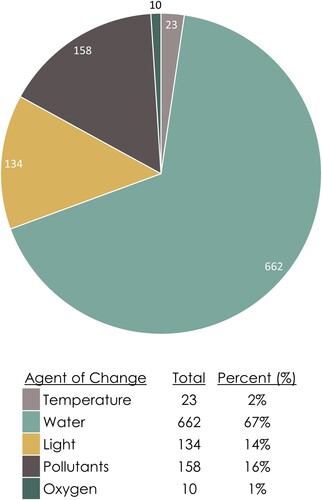
Figure 9. Distribution of susceptibility data entries within the MSD grouped by response to an agent of change.
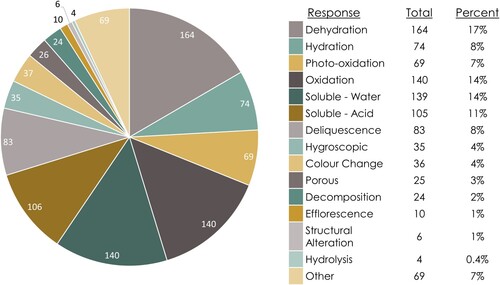
Figure 10. An example of MSD Susceptibility entries for some oxide minerals.
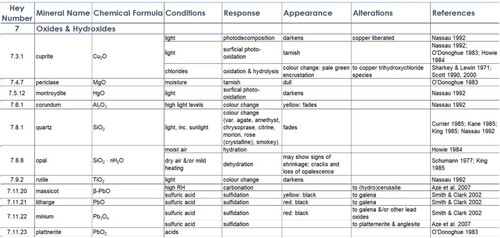
Figure 11. (a) A specimen of melanterite (FeSO4 · 7H2O; OUNHM MIN.26443) and (b) a specimen of epsomite (MgSO4 · 7H2O; NMW.26.151.GR–). Since accession, the specimens have fallen apart and produced powder due to dehydrating into lesser-hydrated sulfates (rozenite (FeSO4 · 4H2O) and hexahydrate (MgSO4 · 6H2O), respectively). Images used with permission of Oxford University Natural History Museum and National Museum Cardiff, respectively.
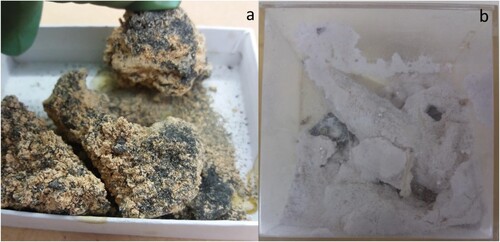
Figure 12. A schematic representation of our proposed, stepwise evaluation of damage. These four steps can be viewed as a simplification of the diagram presented at the beginning of this paper ().