Figures & data
Figure 1. Brick couching (left) and laid couching (right), both at 4 mm spacing, on wool rep fabric. The artificial damage has been created by removing some of the rep’s vertical warp yarns, representing tapestry weft yarns. The images also show the speckle pattern used for DIC registration.
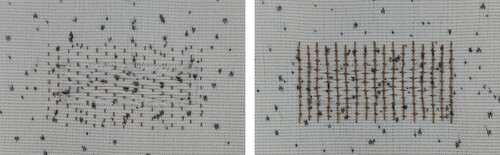
Figure 2. Left: Wool rep sample measuring 350 × 205 mm used in test A. The brown lines show the area of artificial damage measuring 55 × 15 mm. Right: Wool rep sample measuring 650 × 410 mm used in tests B and C, with four areas of artificial damage. 50 mm at the top of each sample was used to clamp the fabric to a vertical board. Lead weights were enclosed within a strip of fabric stitched to the bottom edge.
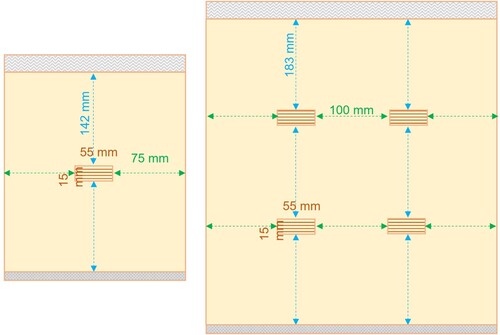
Figure 3. Left: Stitching pattern used in sample B1. Right: Stitching pattern used in sample B2.
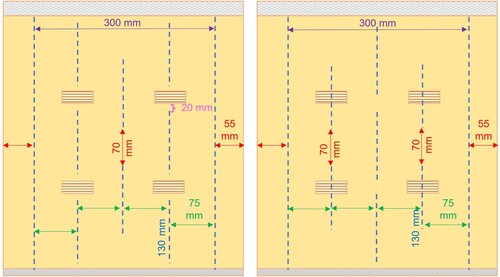
Figure 4. Pattern of artificial damage in the samples used in test C.
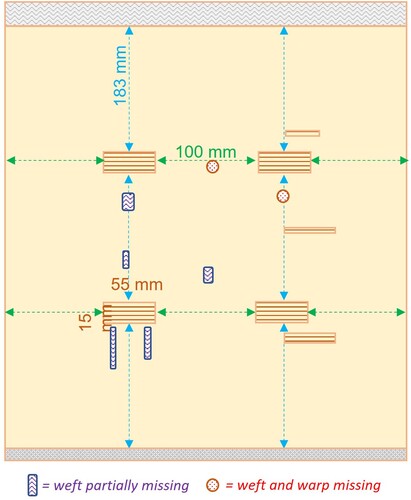
Figure 5. Left: Strain map of the tapestry after hanging for 200 h before conservation treatment. The red box shows the area where conservation treatments were subsequently applied. Centre: Reverse of the tapestry showing first conservation treatment, patched support. Brick couching stitching was carried out at 16 mm spacing (red box), 8 mm spacing (purple boxes), and 4 mm spacing (yellow boxes). Right: Reverse of the tapestry showing second conservation treatment, full support to lower half of the tapestry.
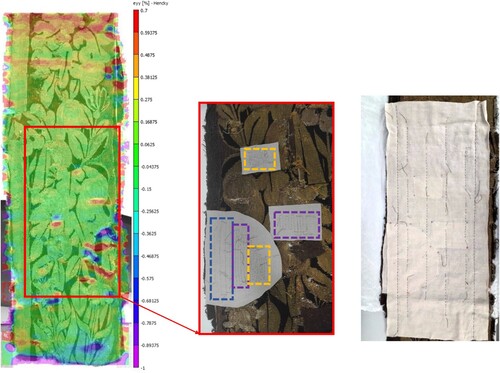
Figure 6. Strain maps, ϵyy (%), after 168 h of monitoring of samples: A1, brick couching 16 mm; A2, brick couching 8 mm; A3, brick couching 4 mm; A4, laid couching 16 mm; A5, laid couching 8 mm; A6, damaged, untreated sample. Note the bright colours at the edges of the samples relate to errors in the DIC data, related to edge effects.
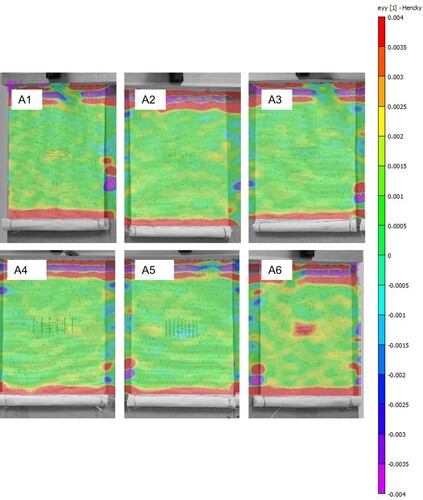
Figure 7. Global longitudinal strain, ϵyy (%), during 168 h of monitoring samples: A1, brick couching 16 mm; A2, brick couching 8 mm; A3, brick couching 4 mm; A4, laid couching 16 mm; A5, laid couching 8 mm; A6, damaged, untreated sample. RH (%) is indicated by the dotted line.
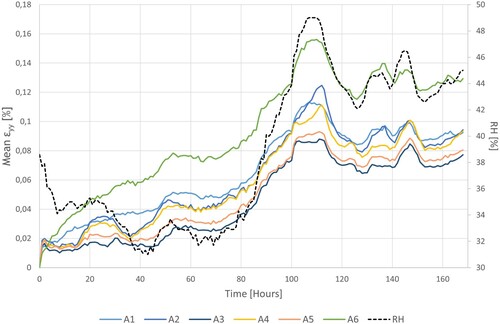
Figure 8. Pseudo-strain, ϵyy (%), across damaged areas of samples during 168 h of monitoring: A1, brick couching 16 mm; A2, brick couching 8 mm; A3, brick couching 4 mm; A4, laid couching 16 mm; A5, laid couching 8 mm; A6, damaged, untreated sample.
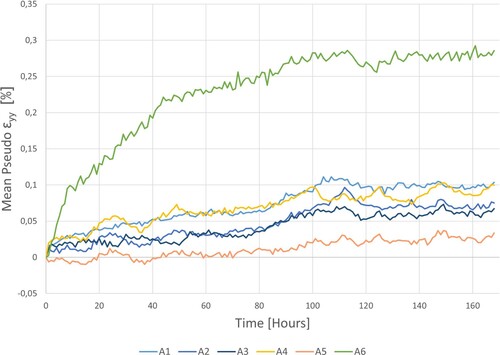
Figure 9. Comparison of global strain and pseudo-strain, ϵyy (%), across two samples during 168 h of monitoring: A1, brick couching 16 mm; A2, brick couching 8 mm.
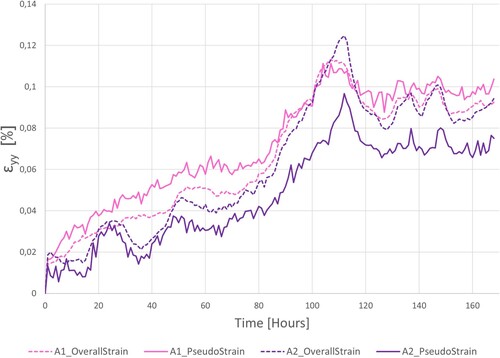
Figure 10. Strain maps, ϵyy (%), after 168 h of monitoring of samples: B1, staggered support lines around the areas of damage; B2, staggered support lines passing through the areas of damage; B3, damaged, untreated sample.
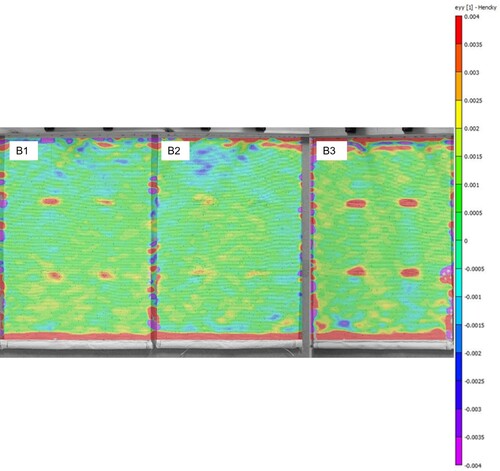
Figure 11. Global longitudinal strain, ϵyy (%), during 168 h of monitoring samples: B1, staggered support lines around the areas of damage; B2, staggered support lines passing through the areas of damage; B3, damaged, untreated sample. RH (%) is indicated by the dotted line.
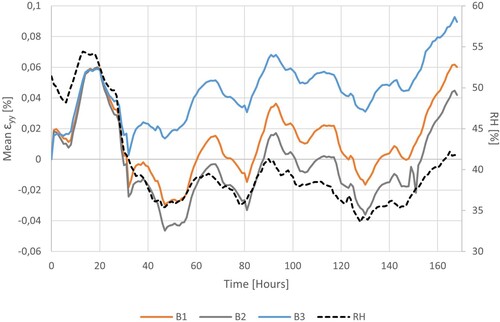
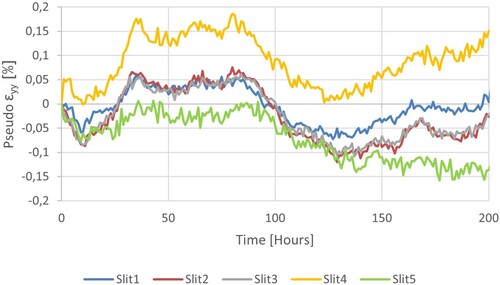
Figure 12. Pseudo-strain, ϵyy (%), across damaged areas of samples during 168 h of monitoring: B1, staggered support lines around the areas of damage; B2, staggered support lines passing through the areas of damage; B3, damaged, untreated sample.
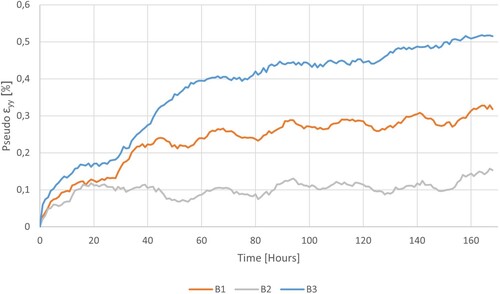
Figure 13. Strain maps, ϵyy (%), after 168 h of monitoring of samples: C1, full support with brick and laid couching; C2, patch support with brick and laid couching; C3, damaged, untreated sample. The location of particularly weak areas is marked within dotted lines.
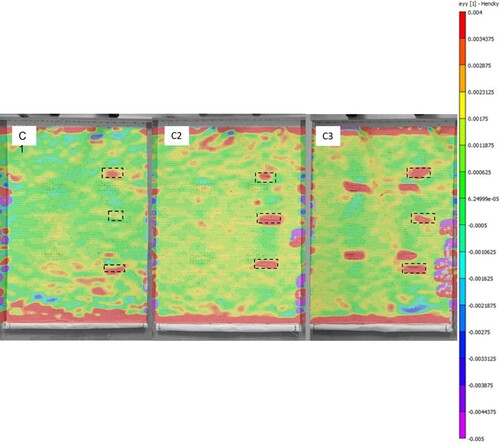
Figure 14. Pseudo-strain, ϵyy (%), across the central damaged areas of samples during 168 h of monitoring: C1, full support with brick and laid couching; C2, patch support with brick and laid couching; C3, damaged, untreated sample.
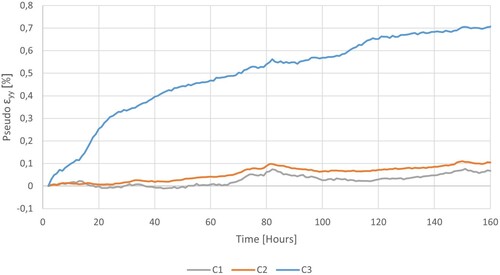
Figure 15. Global longitudinal strain, ϵyy (%), during 168 h of monitoring samples: C1, full support with brick and laid couching; C2, patch support with brick and laid couching; C3, damaged, untreated sample. RH (%) is indicated by the dotted line.
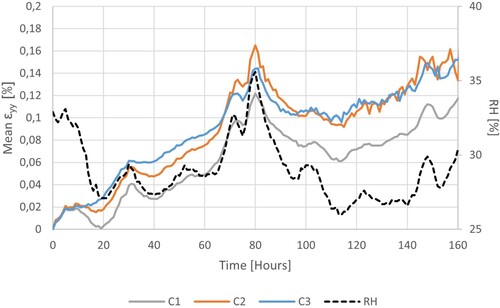
Figure 16. Strain map, ϵyy (%), after 200 h of monitoring the tapestry, after the first stage of conservation treatment, patched support. The inner dotted lines show the area of stitching while the outer dashed lines show the edges of the patches (the edges were not secured).
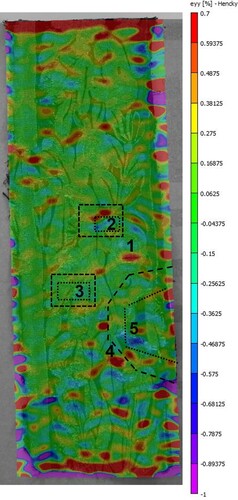
Figure 17. Pseudo strain, ϵyy (%), across damaged areas of the tapestry during 200 h of monitoring after the first stage of conservation treatment, patched support.
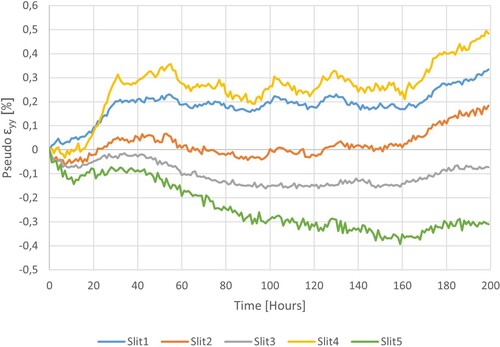
Figure 18. Strain map, ϵyy (%), after 200 h of monitoring the tapestry, after the second stage of conservation treatment, full support to lower half of the tapestry. The upper and lower solid lines demarcate the edge of the linen support fabric.
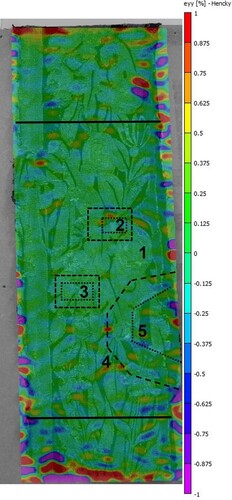
Figure 19. Pseudo strain, ϵyy (%), across damaged areas of the tapestry during 200 h of monitoring after the second stage of conservation treatment, full support to lower half of the tapestry.