Figures & data
Fig. 1 Illustration of the problem statement. Here, the actual geometries of a small number of 3D-printed steel components, each notionally a flat panel, are provided and the aim is to construct a generative statistical model for the actual geometry of a 3D-printed steel component whose notional geometry is cylindrical.
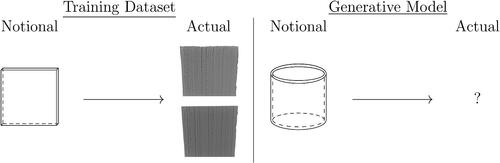
Table 1 Summary statistics traditionally used in surface metrology; here is the profile through the surface of the material and μ is its average or intercept as per (1).
Fig. 2 Laser scan of 3D-printed steel sheet. (a) Photograph of the handheld scanning equipment. (b) Orthographic projection of (a portion of) the scanned sheet, which will be called a panel. The notional thickness of the panel is 3.5mm. [Observe the residual stress induces a slight curvature in the notionally flat panel.]
![Fig. 2 Laser scan of 3D-printed steel sheet. (a) Photograph of the handheld scanning equipment. (b) Orthographic projection of (a portion of) the scanned sheet, which will be called a panel. The notional thickness of the panel is 3.5mm. [Observe the residual stress induces a slight curvature in the notionally flat panel.]](/cms/asset/0cceb3a6-1d2c-4594-b540-352bf3486634/utch_a_2009034_f0002_c.jpg)
Fig. 3 Data are conceptualized as a two-dimensional vector field u on an oriented manifold . The value
represents the height of the upper surface of the material above
, while the value
represents the height of the lower surface below
.
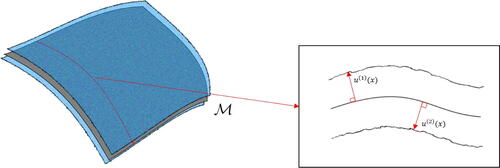
Table 2 Model selection based on the training dataset .
Fig. 4 (a) Laser scan of a section from a real 3D-printed cylinder. (b) Sample from the fitted model generated based on a cylindrical manifold. (c) The distribution over the thickness of the wall of the real (blue, shaded) and the simulated (red, solid) 3D-printed cylinder.
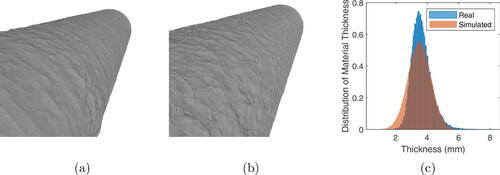
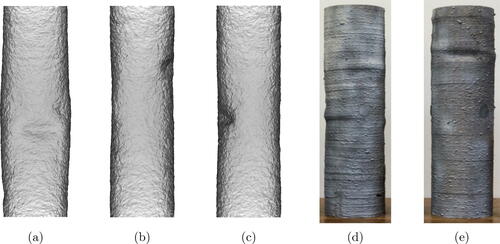
Fig. 5 Predicting the outcome of a compressive test on a 3D-printed cylinder, using the fitted generative model for the geometry of the cylinder and a finite element simulation of the experiment. (a)–(c) Samples from the generative model for the geometry of the cylinder after the simulated compressive test. (d) and (e) Buckled cylinders, experimentally produced. (Reproduced with permission from Buchanan, Wan, and Gardner Citation2018).