
Figures & data
Figure 1. The sample of 3D textile.
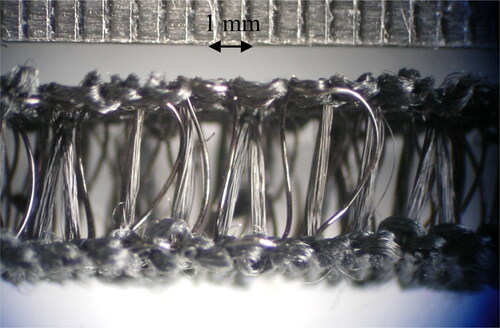
Table 1. Measured construction parameters and air permeability of samples (Zupin et al., Citation2012).
Figure 2. Scheme of the model simulating A Sweating Guarded Hot Plate M259B (Neves et al., Citation2015) experiment.
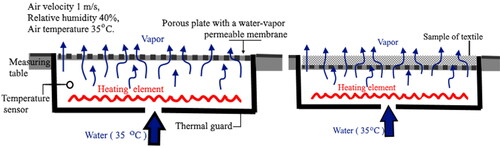
Table 2. Thermal-physiological comfort rating system in accordance with Ret coefficient values (Relji et al., Citation2016).
Figure 3. Geometry of Model 1, Model 2, Model 3, Model 4, Model 5, Model 6.
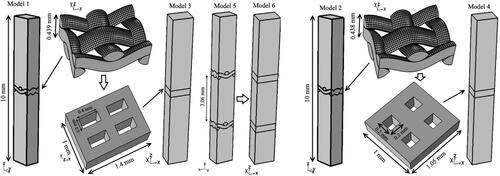
Figure 4. Model 7 geometry with boundary conditions for air permeability simulation.
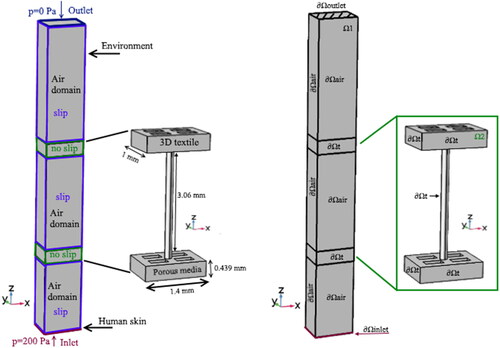
Table 3. Air domain and textile layer parameters.
Table 4. Statistics of completed mesh.
Table 5. Boundary conditions for the simulation of air permeability.
Table 6. Porous matrix properties (Pezzin, Citation2015).
Table 7. Material properties.
Table 8. Boundary conditions for the simulation of water-vapor resistance coefficient.
Table 9. Calculated air permeability and water-vapor resistance values.
Figure 5. Simulation results of Model 7. Distribution of the velocity flow.
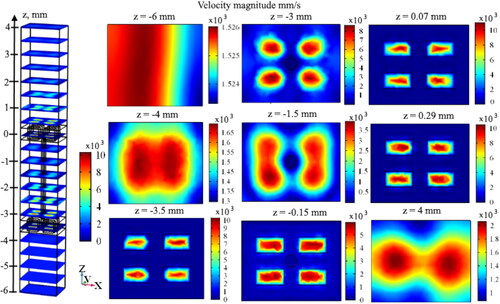
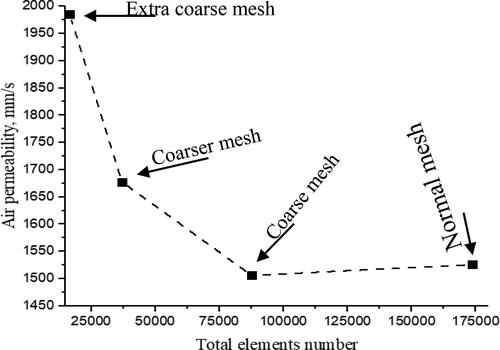
Figure 6. Dependence of calculated air permeability coefficient values against the number of elements.
Table