Figures & data
Figure 1. Roll Stability Advisor (RAS) presented by Winkler et al.[Citation10] showing current lateral acceleration and rollover threshold.
![Figure 1. Roll Stability Advisor (RAS) presented by Winkler et al.[Citation10] showing current lateral acceleration and rollover threshold.](/cms/asset/1d154a55-4919-4ac6-951f-3ce6c00c34d0/nvsd_a_841964_f0001_c.jpg)
Figure 2. Schematic illustration of the active steering system with superposition of torque in a heavy truck for manipulation of steering feel.
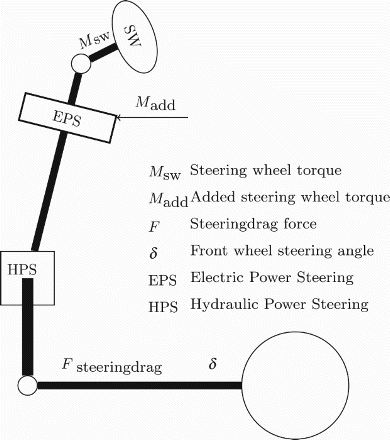
Figure 3. General conception of the presented MSF characteristics for rollover indication in a heavy truck expressed as added steering wheel torque as a function of lateral acceleration.
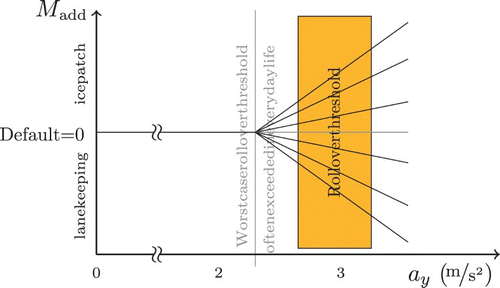
Figure 4. Matlab Simulink model of MSF functionality for rollover indication.
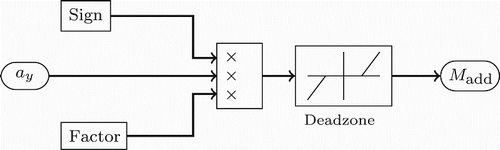
Figure 5. Active steering functionality in a software-in-the-loop environment.
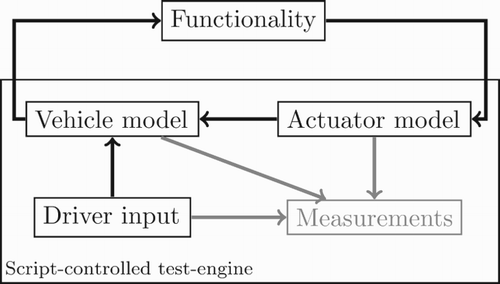
Figure 6. Rollover indication characteristic showing the added steering wheel torque over lateral acceleration presented for Setting 1. The intervention begins at ay=1.6 m/s2 and is limited to Madd, max=8 N m.
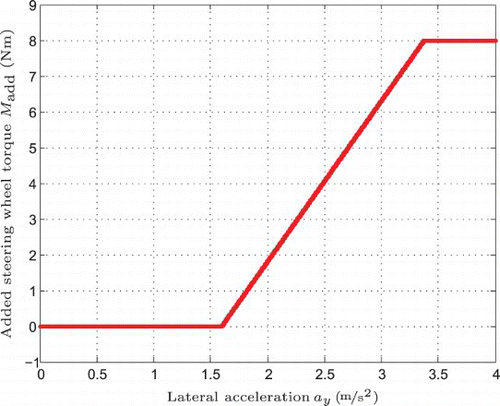
Table 1. Test vehicle properties.
Figure 7. Example plots for two drivers for possible drift detection in mean acceleration over the driver's laps. Every line represents a certain bend: (a) smooth driving and (b) uneven driving.
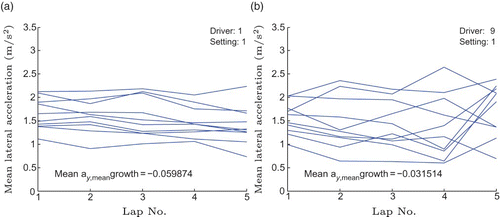
Figure 8. Example plots for two drivers for possible drift detection in maximum acceleration over the driver's laps. Every line represents a certain bend: (a) smooth driving and (b) uneven driving.
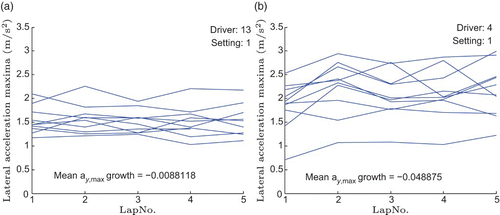
Figure 9. Setting 1 kernel density estimation and its reference calculated from the histogram data (10 curves, all drivers). The significance statement origins from : (a) absolute lateral acceleration: AVERAGES. (b) Absolute lateral acceleration: MAXIMA.
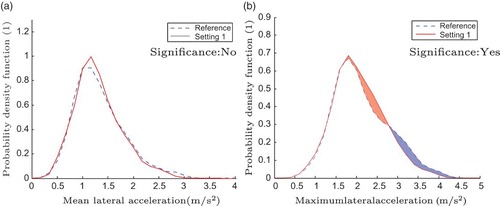
Table 2. Significance for tests on different populations, each setting against its reference taking the samples>1.7 m/s2 into consideration (p-value).
Figure 10. Setting 2 kernel density estimation and its reference calculated from the histogram data (10 curves, all drivers). The significance statement origins from : (a) absolute lateral acceleration: AVERAGES. (b) Absolute lateral acceleration: MAXIMA.
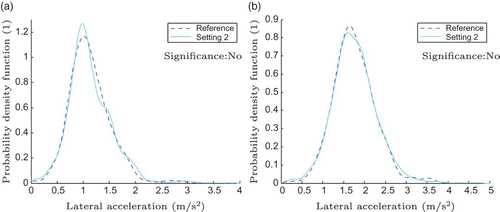
Table 3. Complement to : significance for tests on different populations over full ay-range.
Table 4. Mean differences to reference in maximum and averaged lateral acceleration in each bend.
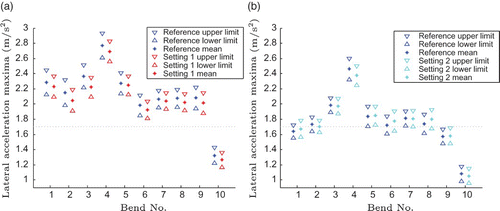
Figure 11. Differences of maximum lateral acceleration with confidence intervals over bends: (a) Setting 1 against its reference. (b) Setting 2 against its reference.