Figures & data
Figure 1. Steering configurations: (a) Parallel steering; (b) Counter steering. For a constant front steering angle, the turn radius is smaller for countersteering as compared to parallel steering [Citation31].
![Figure 1. Steering configurations: (a) Parallel steering; (b) Counter steering. For a constant front steering angle, the turn radius is smaller for countersteering as compared to parallel steering [Citation31].](/cms/asset/be193c8a-5463-4ab1-9dcf-63b4332593a4/nvsd_a_1693049_f0001_oc.jpg)
Figure 2. (a) rural road section (9.1 km), (b) highway section (14.5 km), (c) 2015 Renault Talisman equipped with Multi-Sense used in the experiment. The start/end is visualised with an S-sign, and the driven direction for the rural road is indicated with an arrow.
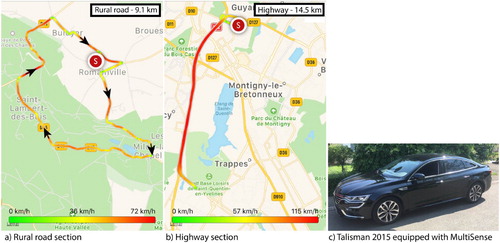
Figure 3. The quarter car linear oscillatory model used to model the suspension travel (X1 – X2) for different road disturbance frequencies (D).
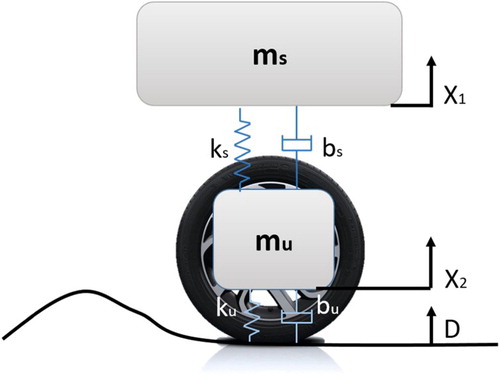
Table 1. Parameters used in the quarter car model. Numbers were provided by Renault. Parameter bs was estimated using our model identification process.
Table 2. The mean and standard deviation results of the four repetitions for the comfort and sport for the combined route, rural road, and highway.
Figure 4. For the rural road section, six recorded variables averaged across four repetitions as a function of travelled distance (left) and for a selected travelled distance interval (right). From top to bottom: mean speed, mean engine speed, mean brake depression, mean steering wheel angle, mean yaw rate, and mean rear wheel angle.
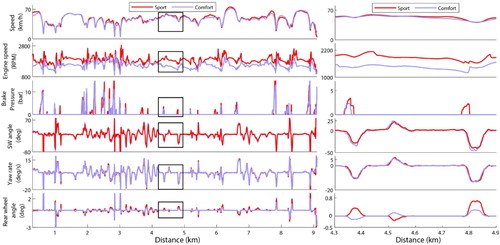
Figure 5. For the highway section, six recorded variables averaged across four repetitions as a function of travelled distance (left) and for a selected travelled distance interval (right). From top to bottom: mean speed, mean engine speed, mean brake depression, mean steering wheel angle, mean yaw rate, and mean rear wheel angle.
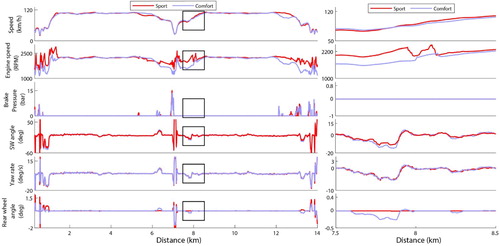
Figure 6. For the rural road section: the ranking of the absolute value of Cohen’s d, that is, the 30 most discriminative measures between the sport mode and comfort mode out of 887 measures. Left: mean of the signal, Middle: standard deviation of the signal, Right: mean absolute successive difference of the signal.
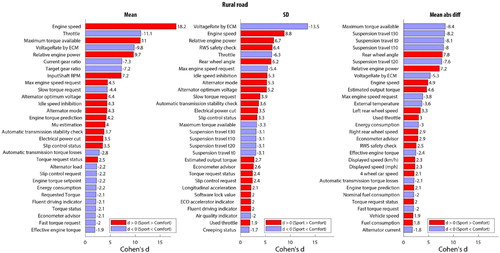
Figure 7. For the highway section: the ranking of the absolute value of Cohen’s d, that is, the 30 most discriminative measures between the sport mode and comfort mode out of 887 measures. Left: mean of the signal, Middle: standard deviation of the signal, Right: mean absolute successive difference of the signal.
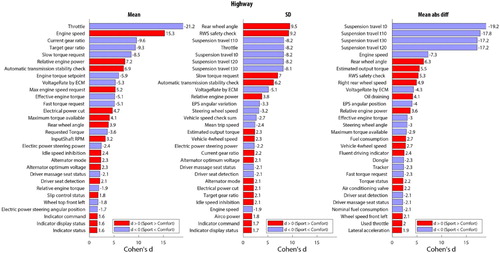
Figure 8. Power spectral density of the vibrations of the suspension travel for the highway section (a) and the rural road section.
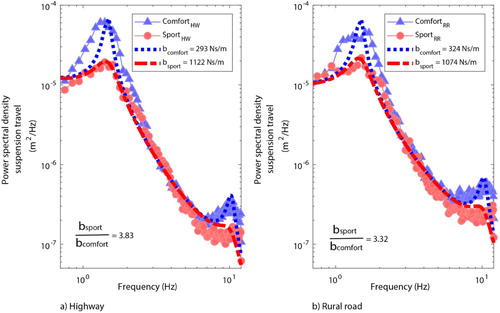
Figure 9. Rear-wheel angle as a function of steering wheel angle for the sport (red) and comfort mode (blue). (a) Steering wheel angle and rear wheel angle between 20 and 30 km/h (light) and 80 and 90 km/h (dark). (b) The slope of the linear regression between steering wheel angle and rear wheel angle per 5 km/h speed bin. Results are based on the combined route and the four repetitions combined.
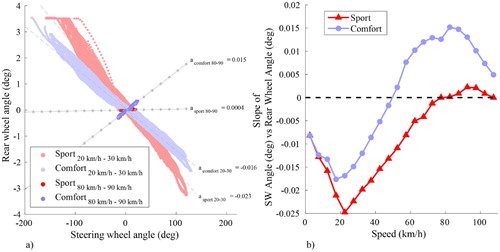
Figure 10. Yaw rate as a function of steering wheel angle for the sport (red) and comfort mode (blue). (a) Steering wheel angle and yaw rate between 20 and 30 km/h (light) and 80 and 90 km/h (dark). (b) The slope of the linear regression between steering wheel angle and yaw rate per 5 km/h speed bin. Results are based on the combined route and the four repetitions combined.
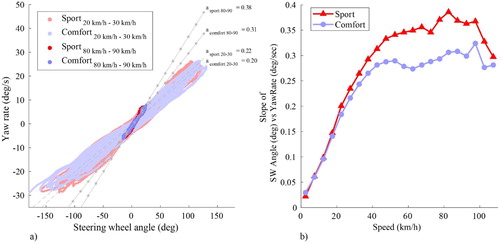
Figure 11. Lateral acceleration as a function of steering wheel angle for the sport (red) and comfort mode (blue). (a) Steering wheel angle and lateral acceleration between 20 and 30 km/h (light) and 80 and 90 km/h (dark). (b) The slope of the linear regression between steering wheel angle and lateral acceleration per 5 km/h speed bin. Results are based on the combined route and the four repetitions combined.
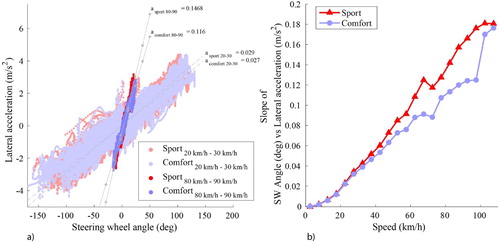
Figure 12. The raw (thin lines) and mean (thick lines) longitudinal acceleration as a function of the brake and throttle depression for the sport and comfort repetitions for the combined route.

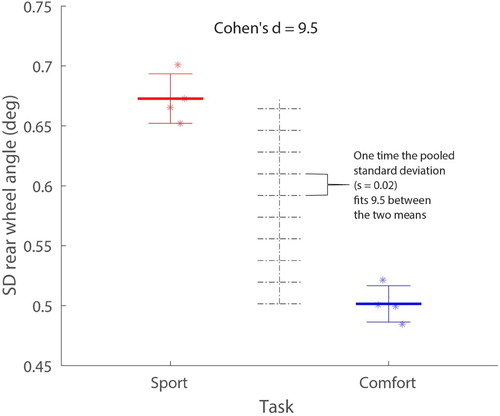
Figure A1. The scores of the four repetitions (asterisks) and means of four repetitions (horizontal lines) for the sport and comfort mode. The whiskers represent the mean ± 1 standard deviation. Cohen’s d represents the number of times the pooled standard deviations fits between the two means.