Figures & data
Figure 1. Distribution map of megasites and Trypillia A sites (M. Nebbia).
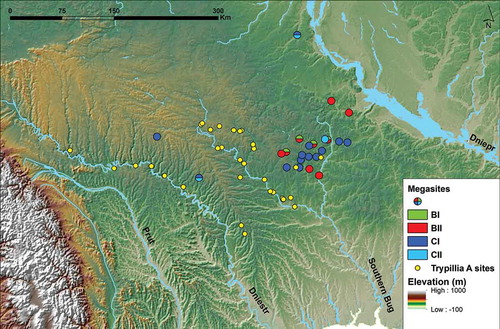
Table 1. The main stages of investigation of Trypillia megasites.
Figure 2. Digitized plan of the Nebelivka geophysical survey. The main architectural features are displayed: ‘regular houses’ (grey), ‘mega houses’ (red), ‘mega-structure’ (green) and external ditch (black) M. Nebbia.
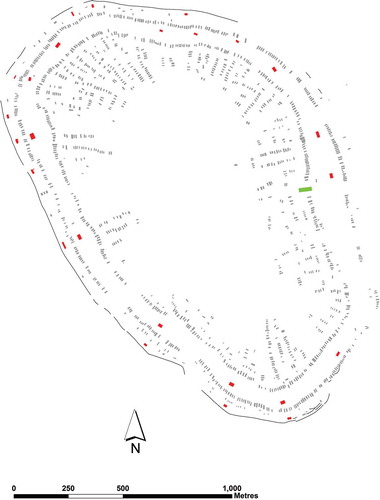
Table 2. The tipping point: arguments against the maximalist hypothesis for Trypillia megasites.
Figure 3. Memory mounds at Nebelivka: (a) early stage; (b) later stage) (B. Gaydarska).
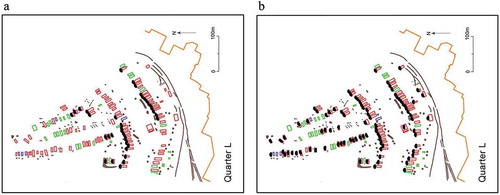
Figure 4. Start and end dates for occupation at Nebelivka, Majdenetske and Taljanki (A. R. Millard).
Figure 5. Hypothetical reconstruction of the first organization of Nebelivka, showing quarters (M. Nebbia).
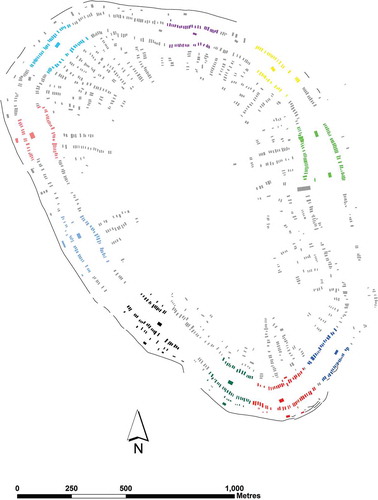
Figure 6. Spatial distribution of Trypillia settlements by phase (M. Nebbia).
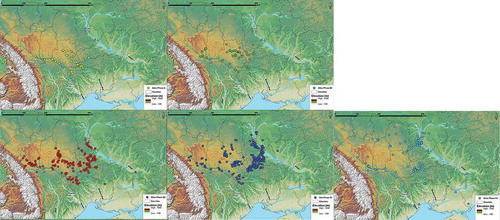
Figure 7. Distribution of Trypillia CII sites. The map has been updated with data collected from Manzura (Citation2005) (M. Nebbia).
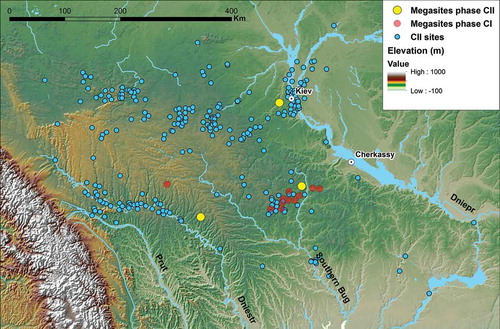
Figure 8. Trajectory of Model A by 30-year generations (J. Chapman).
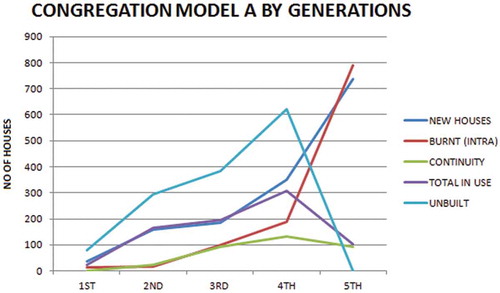
Figure 9. Expansion of the settlement of Quarters, Model B, by 30-year generations: (a) 1st generation (yellow ovals); (b) 2nd generation (green ovals); and (c) 3rd generation (red ovals) (J. Chapman).
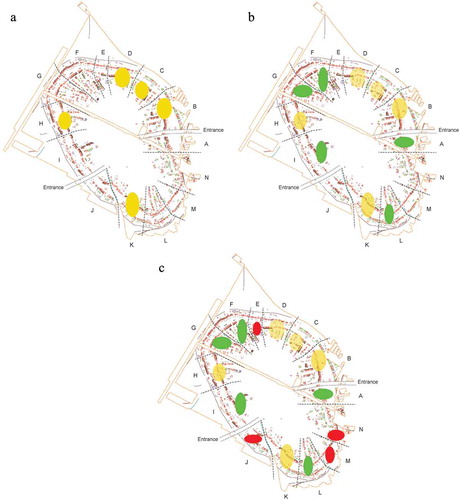
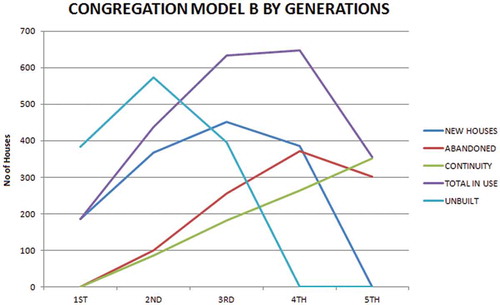
Figure 10. Trajectory of Model B by 30-year generations (J. Chapman).