
Figures & data
Figure 1. The geographical setting of the Longquan celadon industry in Zhejiang Province, China.
Figure 2. Kiln distribution by period within the Eastern Group of Longquan kilns (based on: ZJSWWKGYJS Citation2005, 47–57).
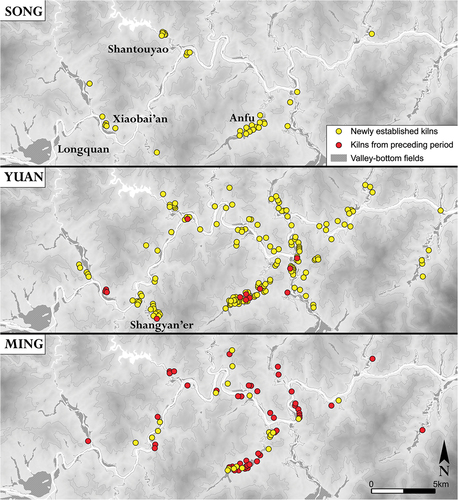
Figure 3. Kiln numbers by period within the Eastern Group of Longquan kilns (based on: ZJSWWKGYJS Citation2005, 47–57).
Figure 4. Plans of the Yuankou kiln and workshop from the Longquan Eastern Group and the Linjiang kiln and workshop from Ji’an (to scale).
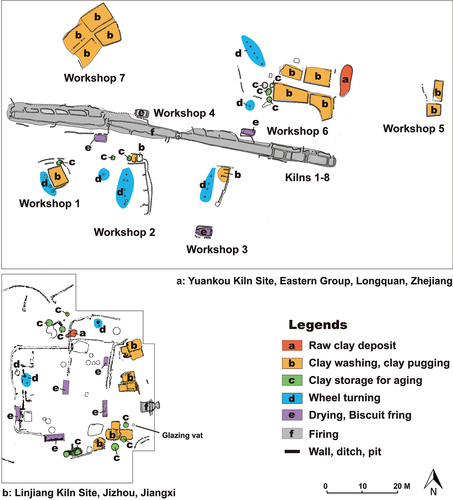
Figure 5. Distribution of Longquan celadon finds across China by period (based on OSM-Part 2).
Table 1. A summary of Longquan celadon objects and assemblages from across China by period, based on 201 published objects and assemblages, 74 from tombs and 127 from domestic contexts (see OSM-Part 2).
Table 2. Occurrence of Longquan celadons in the western Indian Ocean as number of sherds and number of sites where they have been found (see OSM-Part 3).
Figure 6. Longquan celadon sherds from southern Iran, the Williamson Collection (a, c-f) and Kush in Ras al-Khaimah, UAE (b).
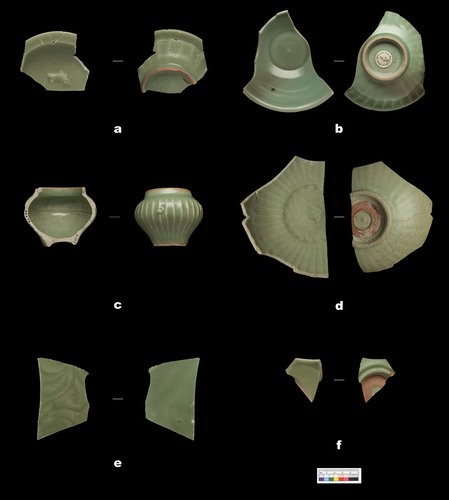
Figure 7. Weighted averages of Longquan celadon finds (columns) and sites with Longquan celadon finds (line) from the western Indian Ocean, 900 to 1700 AD (based on OMS-Part 3).
Figure 8. Distribution of Longquan celadon in the western Indian Ocean, Northern Song to Ming Dynasties (based on Table 2).
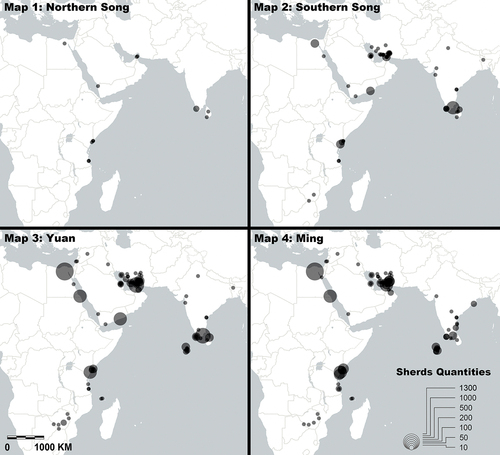
Figure 9. Weighted averages of Longquan celadon imports (LQC) against other Chinese ceramic imports (Others), and the overall quantities of Chinese ceramic finds (Overall) from the Williamson Collection survey area in southern Iran, 900 to 1660 (based on OMS-Part 4).
Figure 10. Distribution of Longquan celadon (grey dots) and other Chinese ceramic imports (black circles) in southern Iran, Northern Song to Ming Dynasties (based on Table 3. Note that 18 sherds of Chinese ceramic imports dated before the Northern Song, 46 dated after Ming Dynasty, and 76 without locations are not included in these maps).
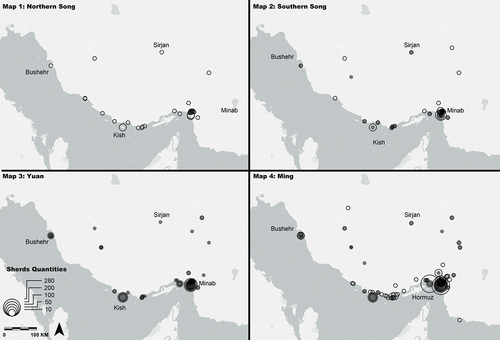
Table 3. A summary of Longquan celadon (LQC) and other Chinese ceramic (Others) sherds (a) and the sites where they were found (b) from the Williamson Collection survey area in southern Iran (see OSM-Part 4).