
Figures & data
Figure 1. The sole tread of the shoes worn (a); an example stain print left by the shoe after stepping in blood and being sprayed with luminol solution (first step of participant 2 on carpet substrate) (b); and step 17 (step point 2) of the same series, from which DNA was sampled (c). The circled area in C represents the approximate area of the stains sampled for DNA (~4.91cm2).
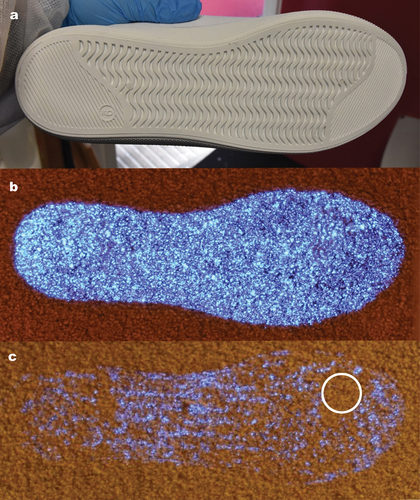
Table 1. Participants’ measurements and characteristics.
Table 2. The number of steps taken by each participant to reach each designated step point (SP).
Figure 2. Amount of DNA (ng) recovered from each step point (SP) for each floor type.
Table 3. The number of donor alleles (excluding amelogenin) within the profiles at step-points 1, 2 and 3 per floor-type for all 5 participants.