Figures & data
Figure 1. Rate of surplus value
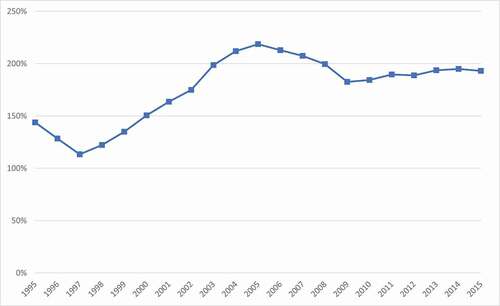
Table 1. Working Time according to China Urban Labour Force Survey (CULS) (hours/week)
Figure 2. Average Working Hours in Urban Manufacturing
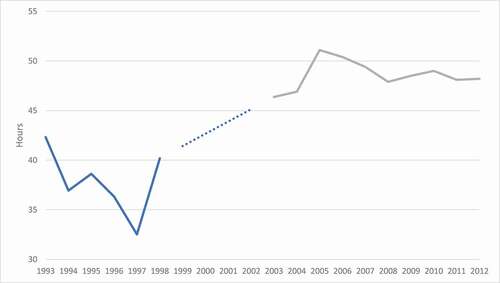
Figure 3. National income
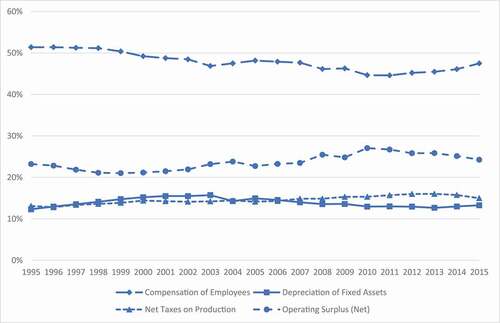
Figure 4. National expenditure
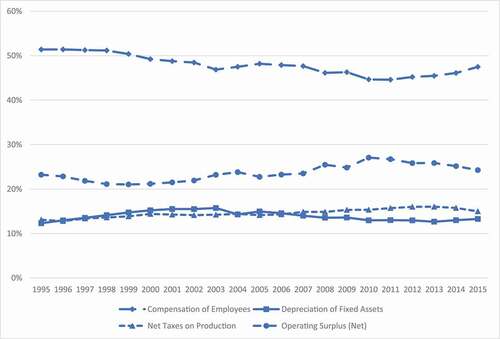
Figure 5. Net export and investment as a share of GDP
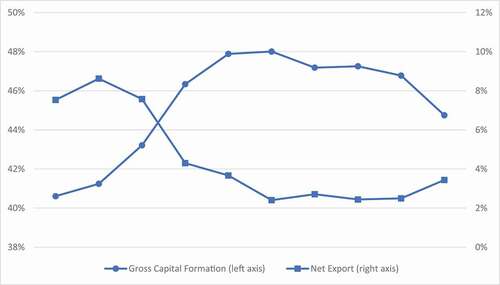
Figure 6. Debt to GDP ratio
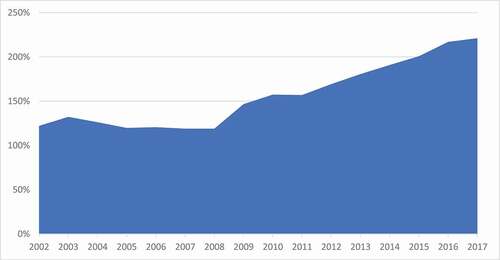
Figure 7. Rates of profit
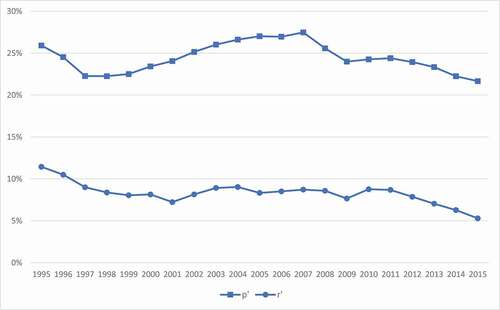
Figure 8. Value composition of capital and the rate of surplus value
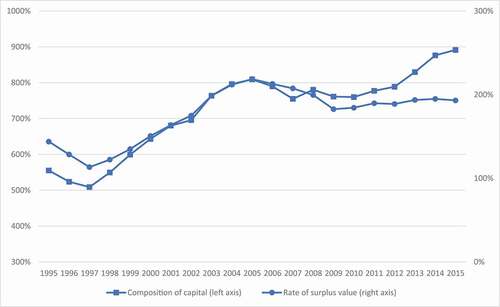
Figure 9. Redistribution of surplus value to non-production activities
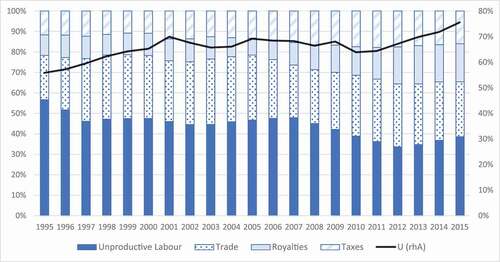
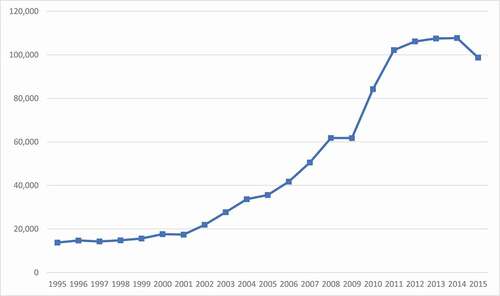
Figure 10. The mass of profit in the production sector (RMB 100 million)